


Fig. 2.
Download original image
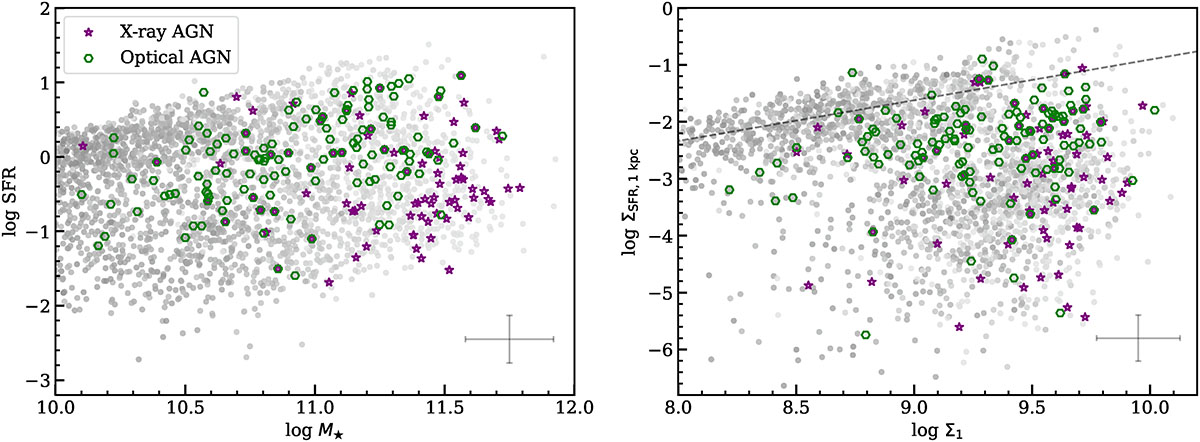
Left: X-ray-selected AGNs and optically selected AGNs on the M★ versus SFR plane, as labeled. All galaxies in the sample are displayed as background points, with grayscale intensity encoding their weights. The error bar in the corner indicates uncertainties in M★ and SFR derived from pyPipe3D SSP decomposition, estimated by comparison with independent measurements (Sánchez et al. 2022). Right: Similar to the left panel, but for the Σ1 versus ΣSFR, 1 kpc plane. The dashed line depicts the spatially resolved star formation MS from Hsieh et al. (2017). The error bar in the corner indicates approximate uncertainty scales for Σ1 and ΣSFR, 1 kpc (see Footnote 2).
Current usage metrics show cumulative count of Article Views (full-text article views including HTML views, PDF and ePub downloads, according to the available data) and Abstracts Views on Vision4Press platform.
Data correspond to usage on the plateform after 2015. The current usage metrics is available 48-96 hours after online publication and is updated daily on week days.
Initial download of the metrics may take a while.