


Fig. 13.
Download original image
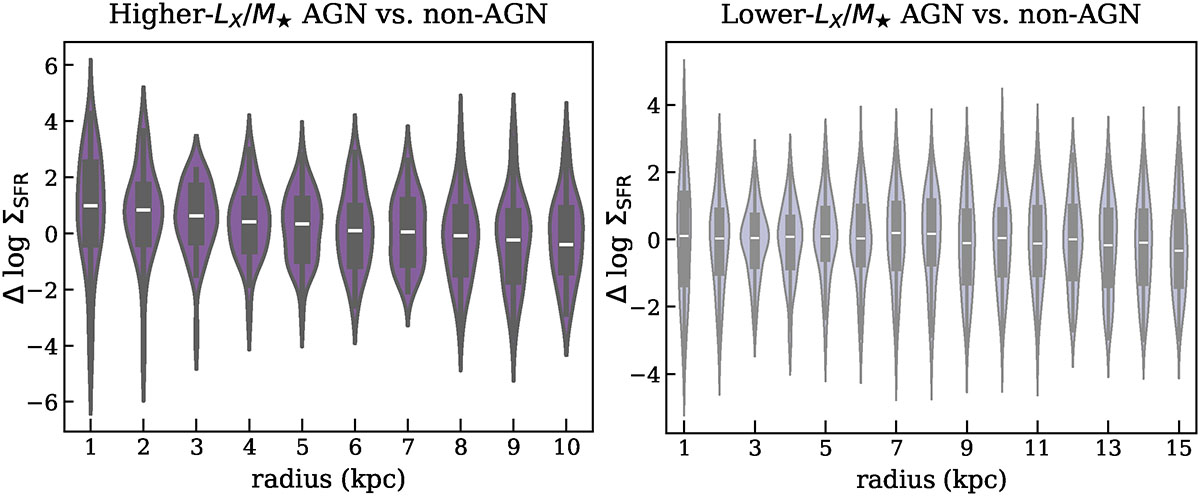
Left: Violin plot showing the distribution of differences in ΣSFR between higher-LX/M★ AGNs and matched control galaxies at each radius. Similar to the mean ΣSFR profiles presented in Fig. 11, clear differences in the medians are also observed, especially in the central regions. However, the distributions of Δ log ΣSFR for individual matched pairs remain broad, spanning both positive and negative values. Right: Similar to the left panel, but for lower-LX/M★ AGNs. The Δ log ΣSFR distributions are also broad, while no clear differences in the medians are observed in galaxy central regions (aligning with the lack of significant differences in the mean ΣSFR profiles).
Current usage metrics show cumulative count of Article Views (full-text article views including HTML views, PDF and ePub downloads, according to the available data) and Abstracts Views on Vision4Press platform.
Data correspond to usage on the plateform after 2015. The current usage metrics is available 48-96 hours after online publication and is updated daily on week days.
Initial download of the metrics may take a while.