


Fig. 1.
Download original image
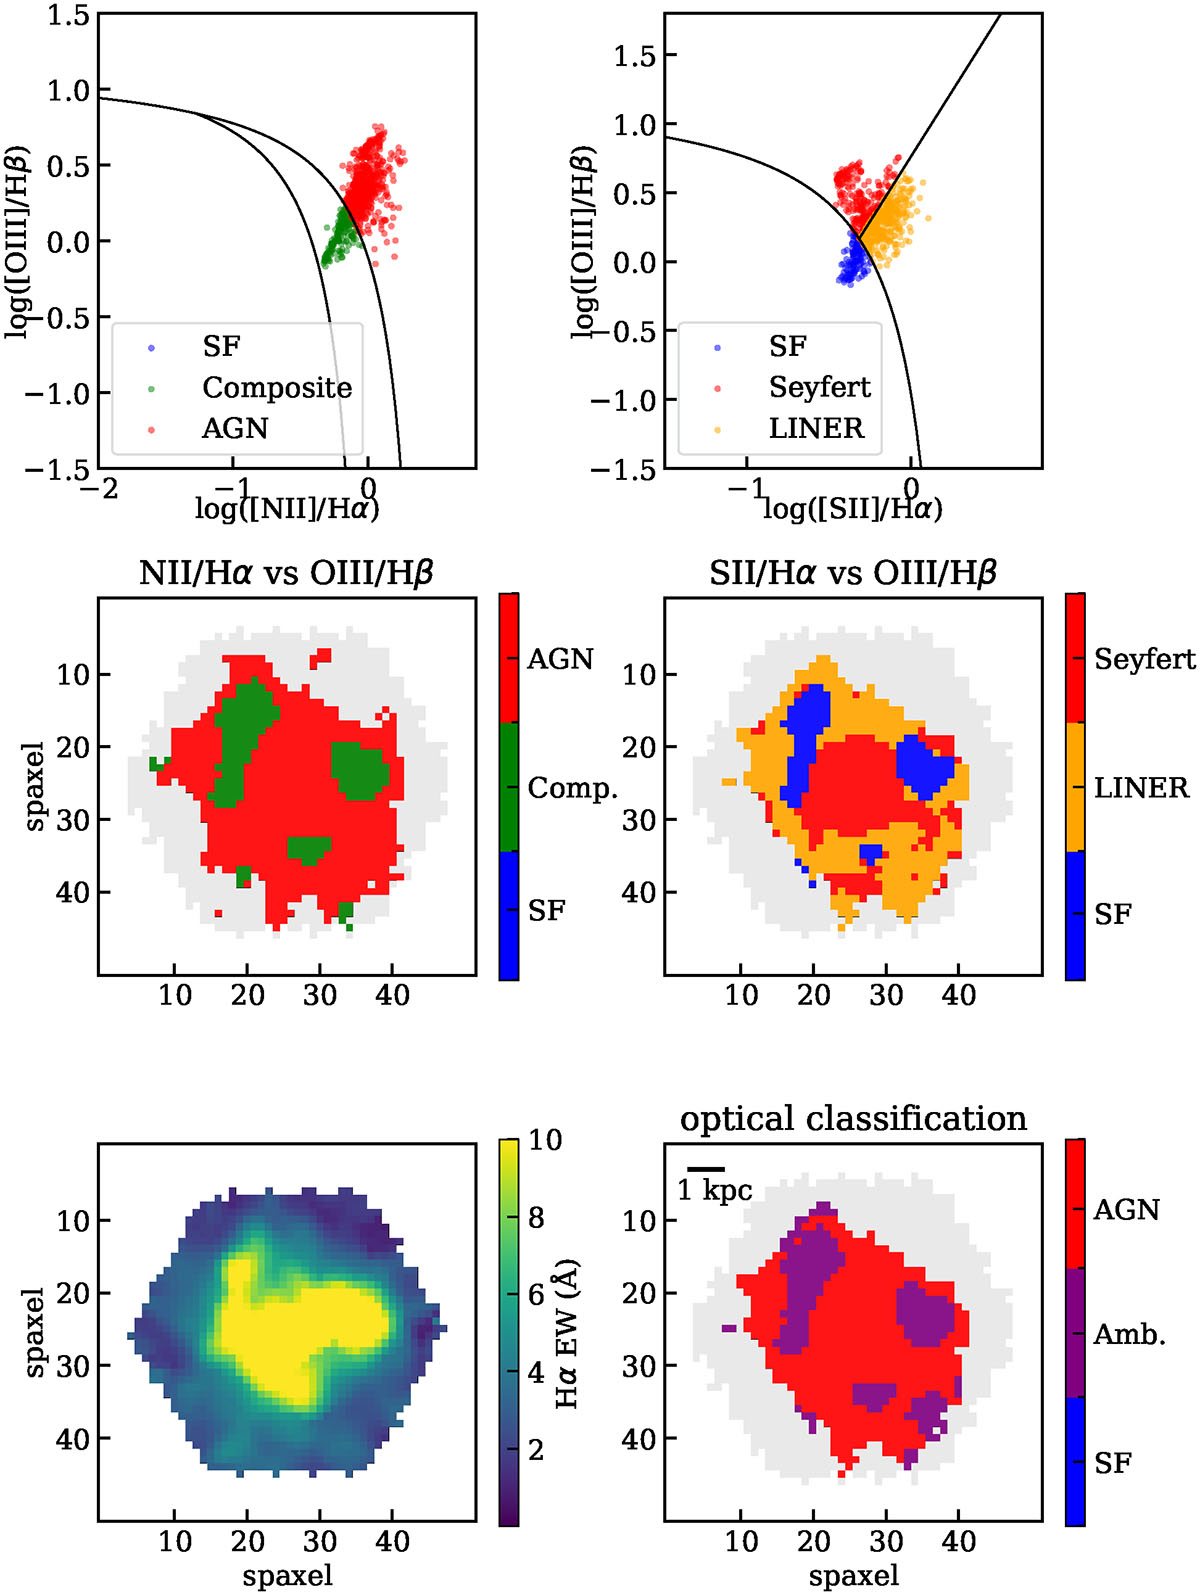
Example of an optically selected AGN. In the top two panels, all the valid spaxels are plotted on the [N II]-based and [S II]-based BPT diagrams. In the middle panels, we show the 2D maps of how these spaxels are classified according to the BPT diagrams. In the lower-left panel, we show the Hα EW map. In the lower-right panel, we show the final spaxel-level classification, which combines all the information.
Current usage metrics show cumulative count of Article Views (full-text article views including HTML views, PDF and ePub downloads, according to the available data) and Abstracts Views on Vision4Press platform.
Data correspond to usage on the plateform after 2015. The current usage metrics is available 48-96 hours after online publication and is updated daily on week days.
Initial download of the metrics may take a while.