


Fig. 4.
Download original image
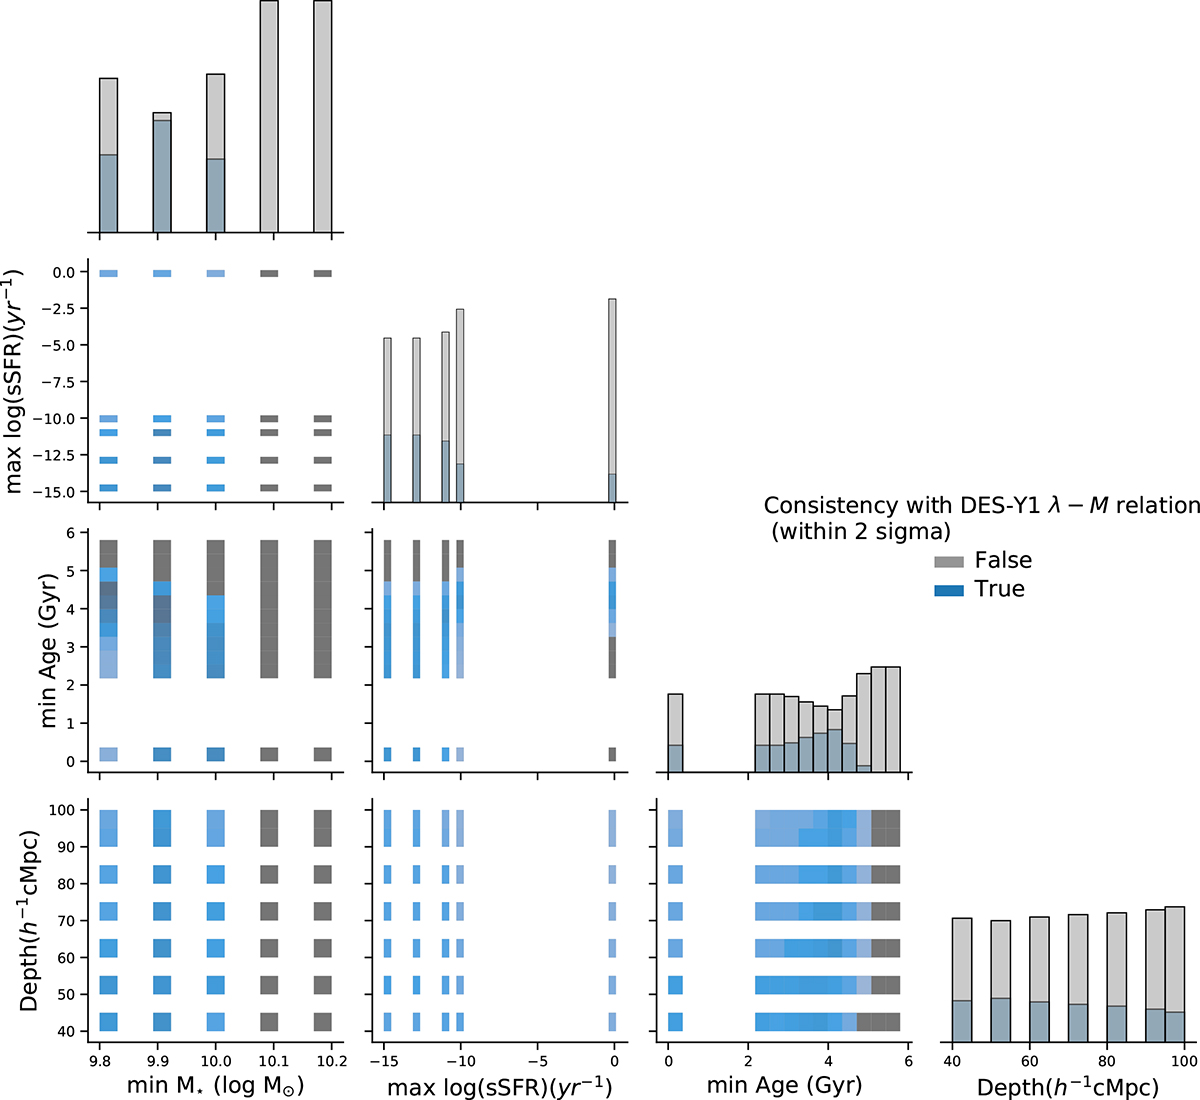
Galaxy-selection criteria explored to examine if the M − λ relations are consistent with the DES-Y1 M − λ relation within 2 σ. The blue squares are color-coded by the distribution of the selection criteria that generate M − λ relations consistent with DES-Y1 across the full redshift range z = 0.2 − 0.6 and within each of the four redshift bins. The “min stellar mass” denotes the minimum value set at z = 0.65 for the redshift evolution of the stellar mass cut.
Current usage metrics show cumulative count of Article Views (full-text article views including HTML views, PDF and ePub downloads, according to the available data) and Abstracts Views on Vision4Press platform.
Data correspond to usage on the plateform after 2015. The current usage metrics is available 48-96 hours after online publication and is updated daily on week days.
Initial download of the metrics may take a while.