


Fig. 2.
Download original image
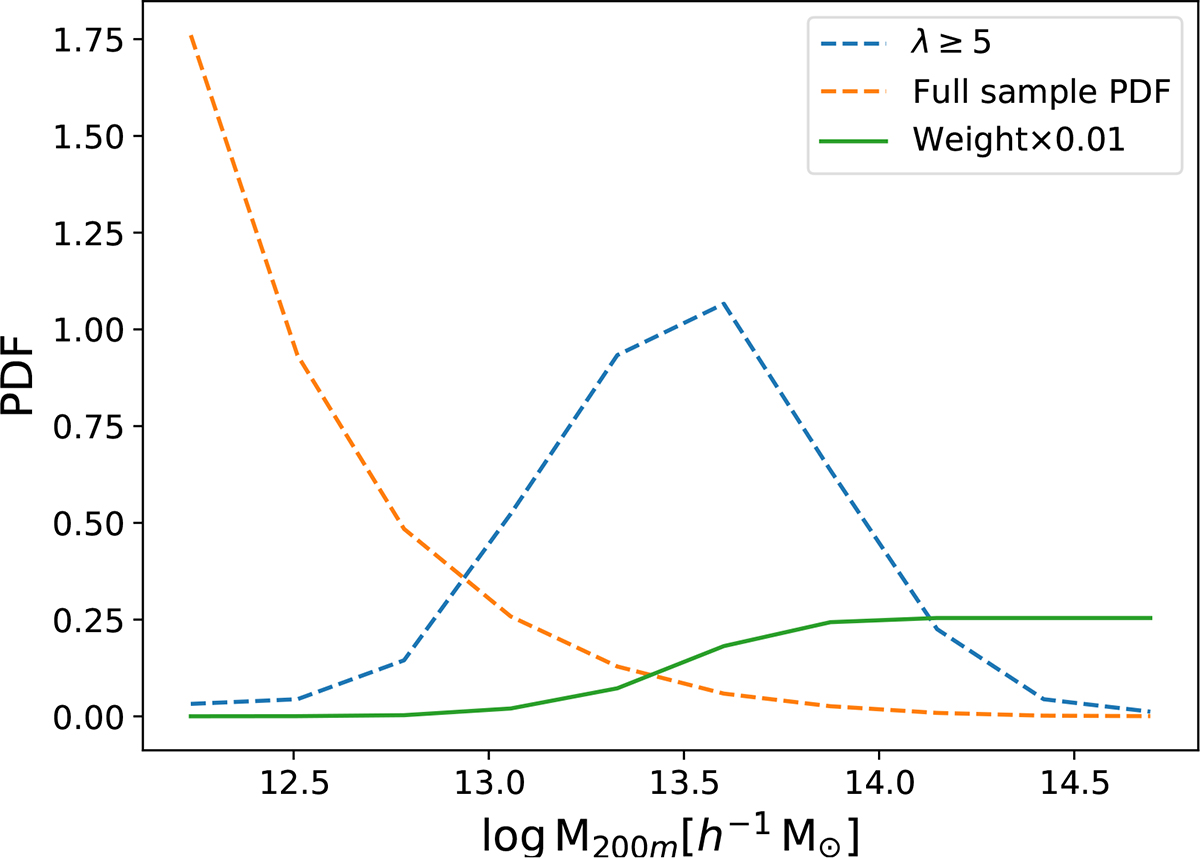
Mass distribution of the clusters with λ ≥ 5, shown as probability distribution function (dashed blue line). The galaxy-selection criteria used here are the same as in Fig. 1. The dashed orange line represents the mass distribution of halos with log(M200m/h−1 M⊙) ≥ 12.1 in the light cone. The green line indicates the weight applied to reconstruct the unbiased signal, scaled by a factor of 0.01 for visual comparison.
Current usage metrics show cumulative count of Article Views (full-text article views including HTML views, PDF and ePub downloads, according to the available data) and Abstracts Views on Vision4Press platform.
Data correspond to usage on the plateform after 2015. The current usage metrics is available 48-96 hours after online publication and is updated daily on week days.
Initial download of the metrics may take a while.