


Fig. 1.
Download original image
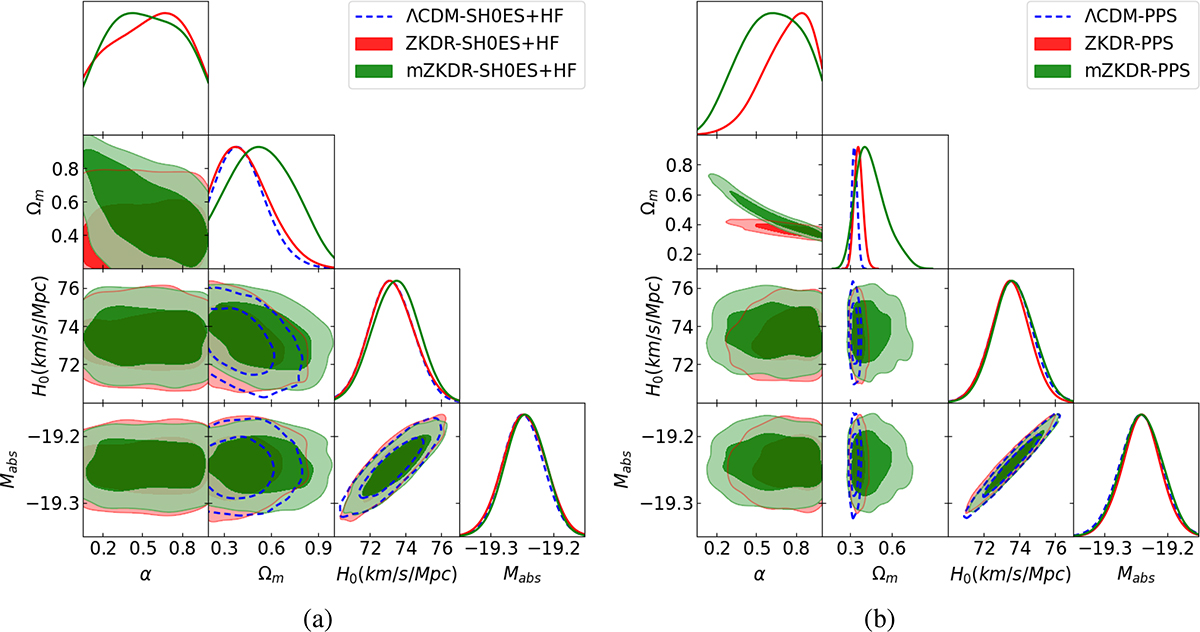
Results of the statistical analyses assuming a flat universe and constant α. The darker and brighter regions correspond to 65% and 95% confidence levels, respectively. The plots in the diagonal show the posterior probability density for each of the free parameters of the scenarios. The left panel shows the results for SH0ES+HF dataset only while the right panel shows the results for PPS. For comparison, the dashed blue curves represent the analyses for the standard (FLRW) ΛCDM model (α = 1).
Current usage metrics show cumulative count of Article Views (full-text article views including HTML views, PDF and ePub downloads, according to the available data) and Abstracts Views on Vision4Press platform.
Data correspond to usage on the plateform after 2015. The current usage metrics is available 48-96 hours after online publication and is updated daily on week days.
Initial download of the metrics may take a while.