


Fig. 8.
Download original image
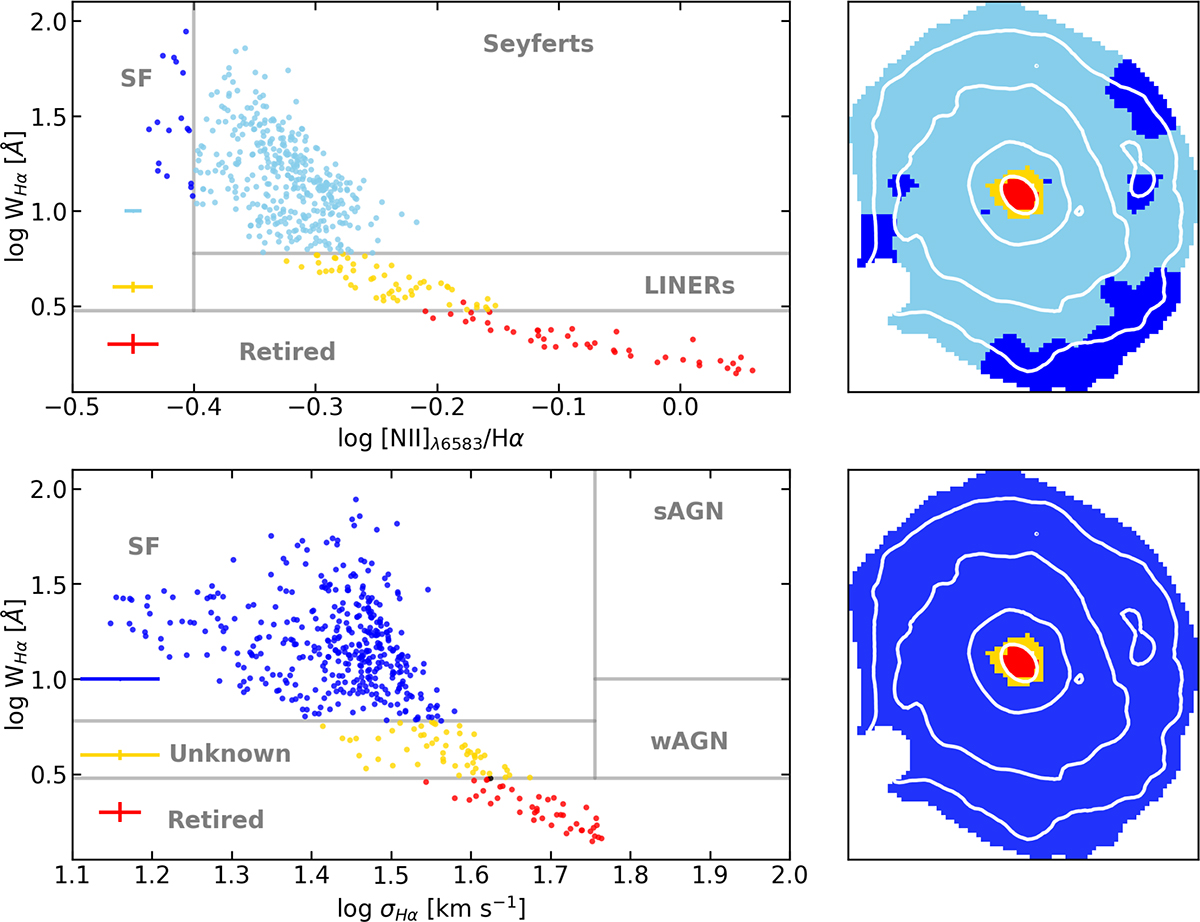
WHAN (top) and WHaD (bottom) diagrams for W2246f on the left and the corresponding maps on the right. The grey lines demonstrate the regions of each diagram that are dominated by different ionisation sources, such as star formation (SF), Seyferts (sAGN), LINERS (wAGN), and HOLMES in retired regions of the galaxy. The error bars on the left show the mean uncertainties for the points in each region of the diagram, where the points in the star-forming and Seyferts regions of the WHAN diagram have been combined to give a single error. The colours in the plots and the maps reflect which part of the WHAN and WHaD diagram those bins lie in to better show their spatial distribution across the galaxy.
Current usage metrics show cumulative count of Article Views (full-text article views including HTML views, PDF and ePub downloads, according to the available data) and Abstracts Views on Vision4Press platform.
Data correspond to usage on the plateform after 2015. The current usage metrics is available 48-96 hours after online publication and is updated daily on week days.
Initial download of the metrics may take a while.