


Fig. 1.
Download original image
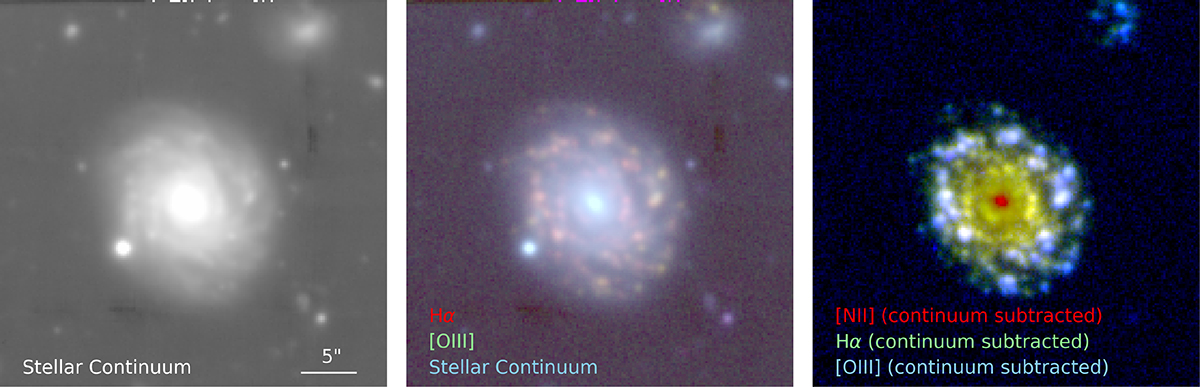
Images of W2246f and its companion galaxy to the north-west, extracted from the MUSE datacube. On the left is the white light image showing the stellar continuum. In the middle is an RGB image with the Hα emission in red, the [O III] emission in green and the stellar continuum in blue. In this image the Hα and [O III] maps have not been continuum subtracted. On the right is a continuum-subtracted image showing the [N II] λ6584 emission in red, the Hα emission in green, and the [O III] emission in blue. The images are oriented with north up and east to the left, and a scale bar is shown in the stellar continuum image for reference, where 5″ corresponds to ∼9.15 kpc.
Current usage metrics show cumulative count of Article Views (full-text article views including HTML views, PDF and ePub downloads, according to the available data) and Abstracts Views on Vision4Press platform.
Data correspond to usage on the plateform after 2015. The current usage metrics is available 48-96 hours after online publication and is updated daily on week days.
Initial download of the metrics may take a while.