


Fig. A.6.
Download original image
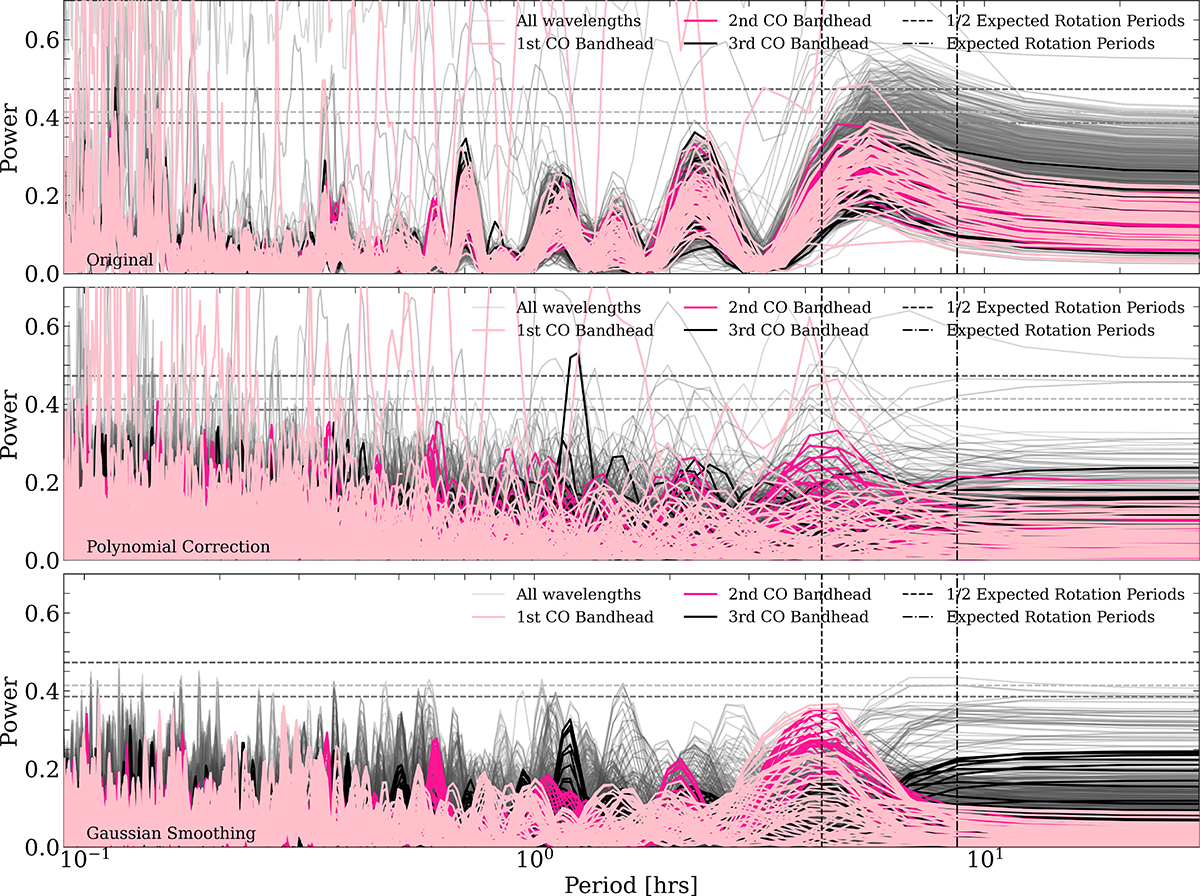
GLS periodograms of individual wavelength contrast light curves. In each of the panels, the light pink, dark pink, and black highlighted lines are the first, second, and third 12CO band heads, respectively. The horizontal grey lines indicate the 1%, 5%, and 10% false alarm probabilities. The vertical black lines indicate the expected rotation period at 8.7 hrs and its first integer harmonic at 4.35 hrs. Top: Uncorrected periodogram, with all wavelengths significantly affected by systematic effects caused by the fibre coupling. Middle: Periodogram after the polynomial correction. Bottom: Gaussian smoothing added to the periodogram to highlight the strong periodic signals.
Current usage metrics show cumulative count of Article Views (full-text article views including HTML views, PDF and ePub downloads, according to the available data) and Abstracts Views on Vision4Press platform.
Data correspond to usage on the plateform after 2015. The current usage metrics is available 48-96 hours after online publication and is updated daily on week days.
Initial download of the metrics may take a while.