


Fig. A.4.
Download original image
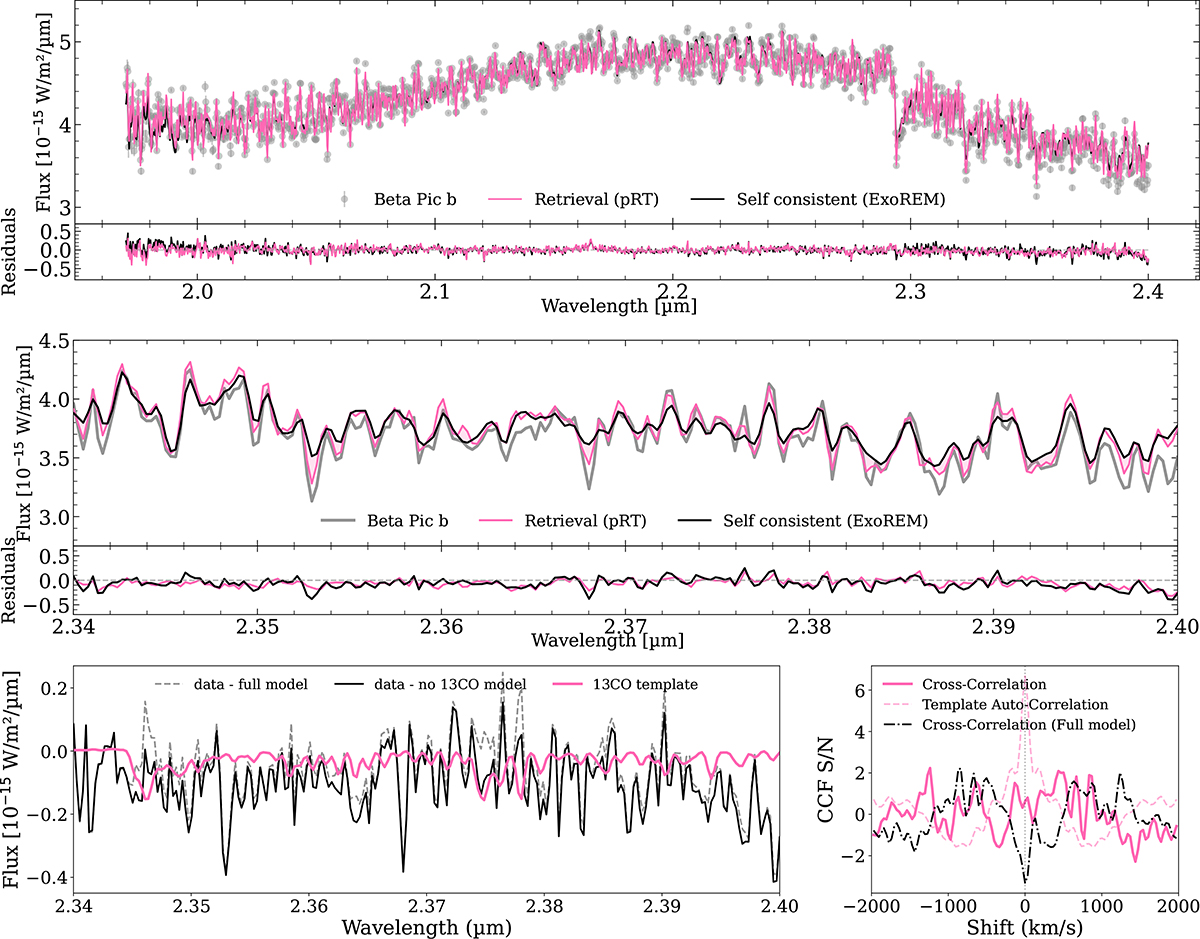
Top panel: Comparison between the retrieval (pink) and the self-consistent model (black), as well as their respective residuals to the data. Middle panel: Zoom-in on the active 13CO absorption region between 2.34 μm and 2.4 μm. Bottom panel: Cross-correlation templates for the self-consistent model similar to Fig. A.3 together with the cross-correlation function.
Current usage metrics show cumulative count of Article Views (full-text article views including HTML views, PDF and ePub downloads, according to the available data) and Abstracts Views on Vision4Press platform.
Data correspond to usage on the plateform after 2015. The current usage metrics is available 48-96 hours after online publication and is updated daily on week days.
Initial download of the metrics may take a while.