


Fig. A.3.
Download original image
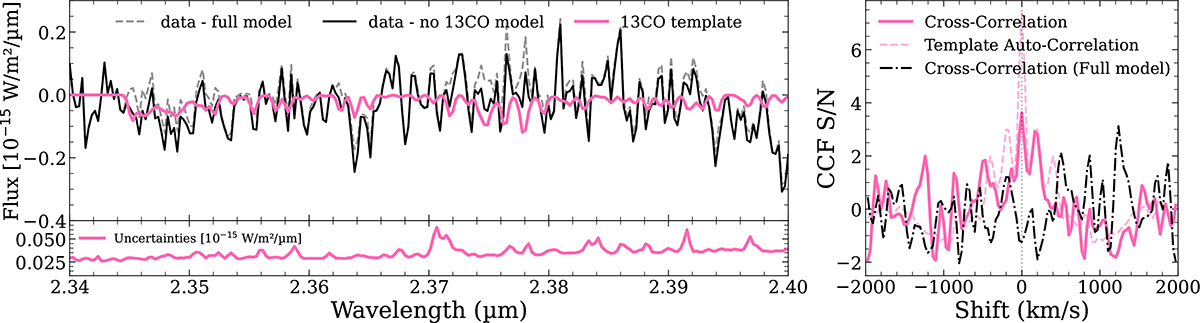
Top panel: Cross-correlation templates created from the retrieved models. The observational residuals, shown in black, are the data and the best-fit model, with 13CO turned off, subtracted. In pink, the best-fit model is subtracted from that same model but with 13CO manually turned off, yielding the 13CO template. The dashed grey line shows the residuals when subtracting the full model from the data. Bottom panel: Observational uncertainties, by which we weighted the residuals. Right panel: Cross-correlation function for each of the residuals with the 13CO template. The CCF between the 13CO residuals remaining in the data and the 13CO template is shown in pink, while the dot-dashed black line shows the cross-correlation between the full model residuals and the 13CO template. The autocorrelation of the 13CO signal is shown with the dashed light-pink line.
Current usage metrics show cumulative count of Article Views (full-text article views including HTML views, PDF and ePub downloads, according to the available data) and Abstracts Views on Vision4Press platform.
Data correspond to usage on the plateform after 2015. The current usage metrics is available 48-96 hours after online publication and is updated daily on week days.
Initial download of the metrics may take a while.