


Fig. 8.
Download original image
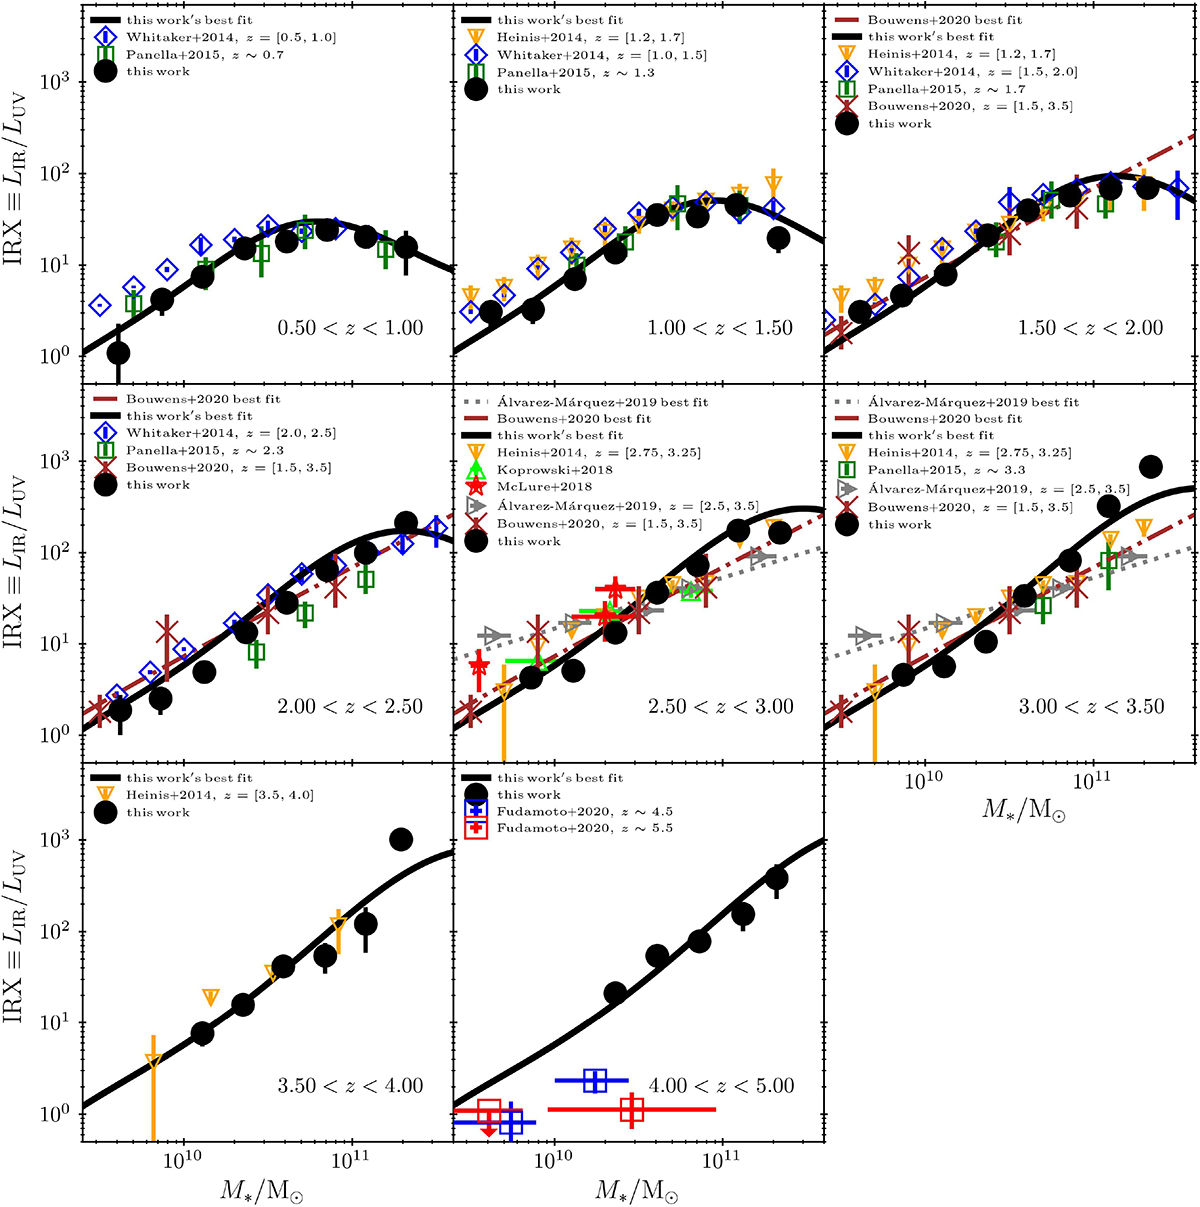
IRX-M* relationship for the 0.5 < z ≤ 5.0 sample of this work. The black circles with error bars show IRX values median-stacked in bins of M* (Table A.3; same as color points in Figure 6). The black curves show corresponding best-fit functional forms summarized in Table 2 (same as color curves in Figure 6). For comparison, recent literature data of Whitaker et al. (2014), Heinis et al. (2014), Pannella et al. (2015), McLure et al. (2018), Koprowski et al. (2018), Álvarez-Márquez et al. (2019), Bouwens et al. (2020) and Fudamoto et al. (2020a) are also plotted, the discussion of which is presented in Section 4.5.
Current usage metrics show cumulative count of Article Views (full-text article views including HTML views, PDF and ePub downloads, according to the available data) and Abstracts Views on Vision4Press platform.
Data correspond to usage on the plateform after 2015. The current usage metrics is available 48-96 hours after online publication and is updated daily on week days.
Initial download of the metrics may take a while.