


Fig. 5.
Download original image
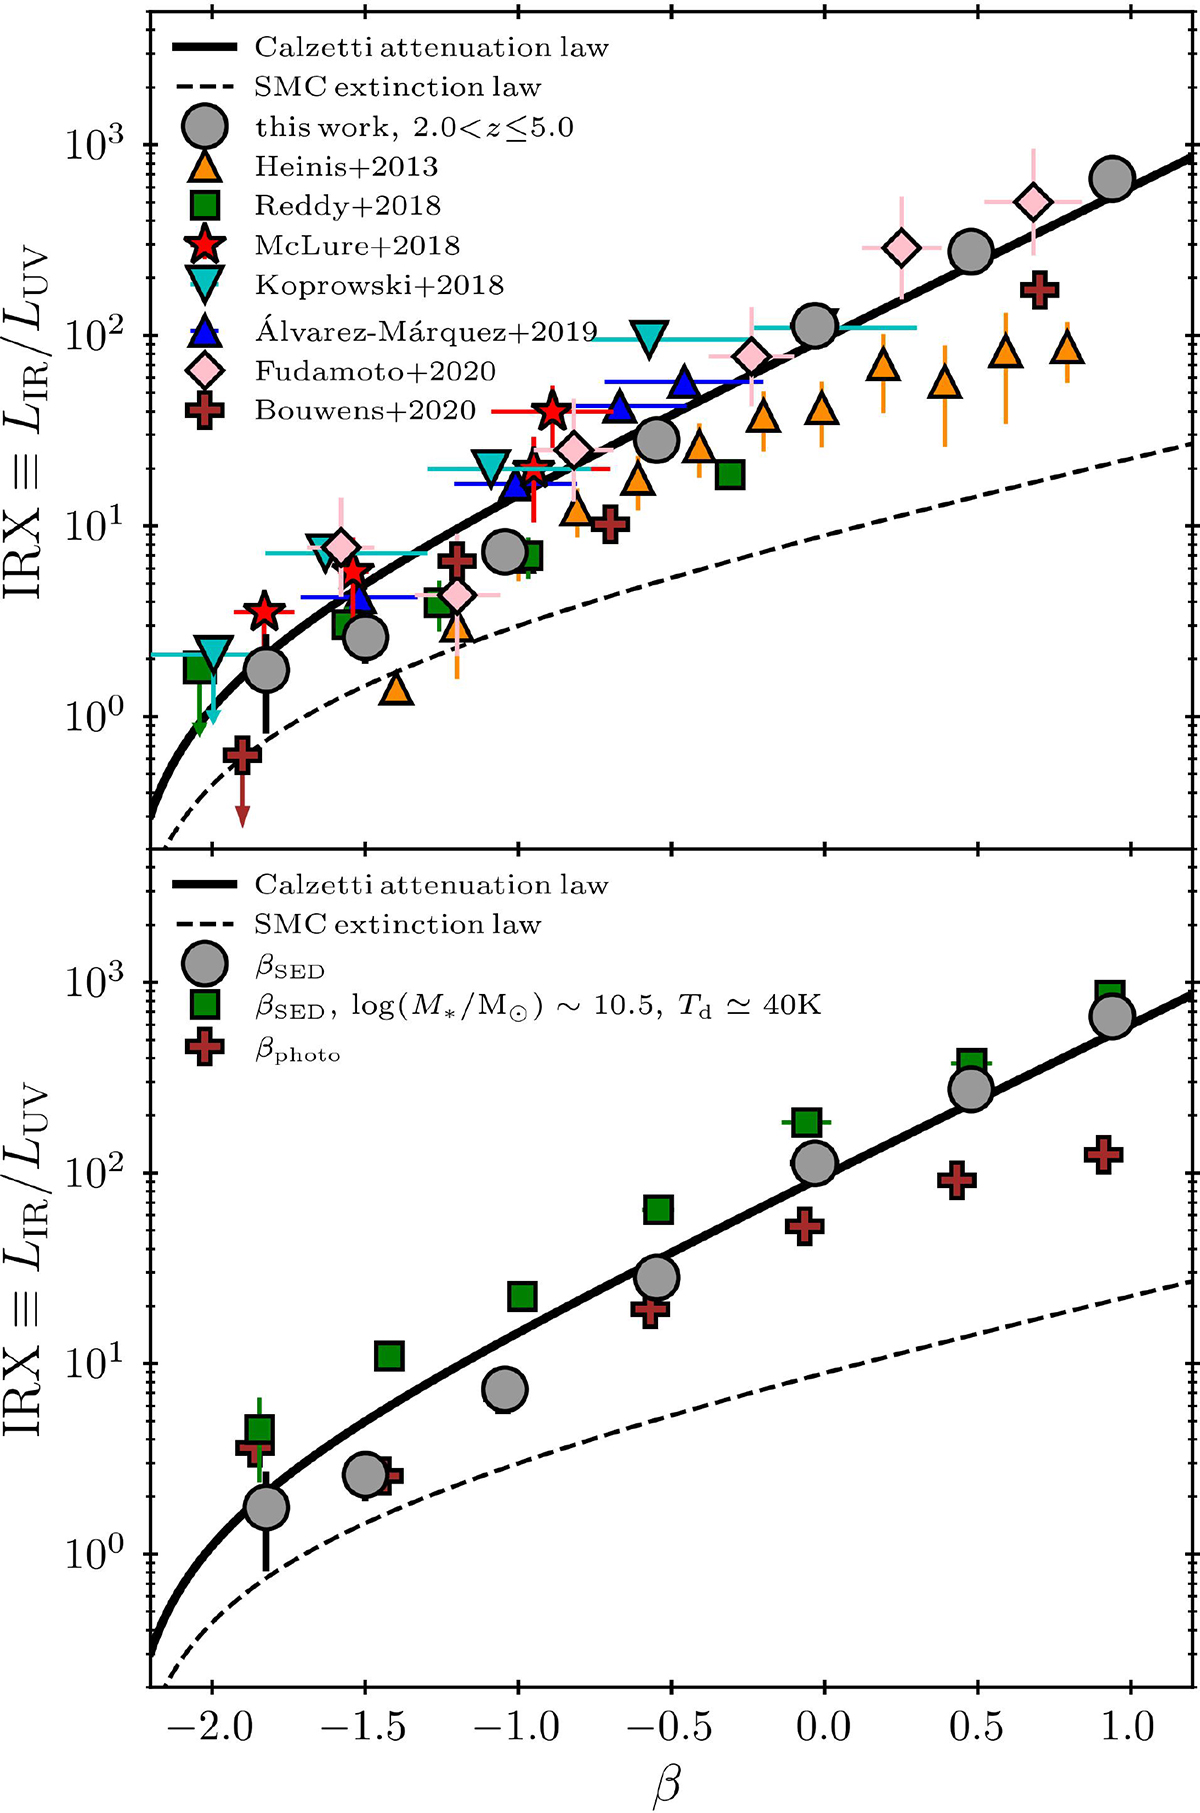
IRX-β relationship derived for the 2.0 < z ≤ 5.0 sample of this work (gray circles; Table A.2). Top panel. Our median data lying slightly below the best-fit curve at blue UV slopes is driven by variations in the corresponding median stellar masses. We compare our data with the recent literature results of Heinis et al. (2013), Reddy et al. (2018), McLure et al. (2018), Koprowski et al. (2018), Álvarez-Márquez et al. (2019), Fudamoto et al. (2020b) and Bouwens et al. (2020). For reference, this work’s best-fit relationship and the SMC-like curve are plotted in solid and dashed lines, respectively. Bottom panel. To investigate the literature scatter, we highlight how varying data treatment methodologies alters our results (gray circles). Adopting a dust temperature of Td = 40 K with a restricted stellar mass of log(M*/M⊙)∼10.5 (green squares), or deriving UV slopes via photometric power-law fitting instead of best-fit SEDs (red crosses), radically changes the shape and normalization of the relation, mirroring the scatter seen in the top panel. See Section 4.3 for details.
Current usage metrics show cumulative count of Article Views (full-text article views including HTML views, PDF and ePub downloads, according to the available data) and Abstracts Views on Vision4Press platform.
Data correspond to usage on the plateform after 2015. The current usage metrics is available 48-96 hours after online publication and is updated daily on week days.
Initial download of the metrics may take a while.