


Fig. 4.
Download original image
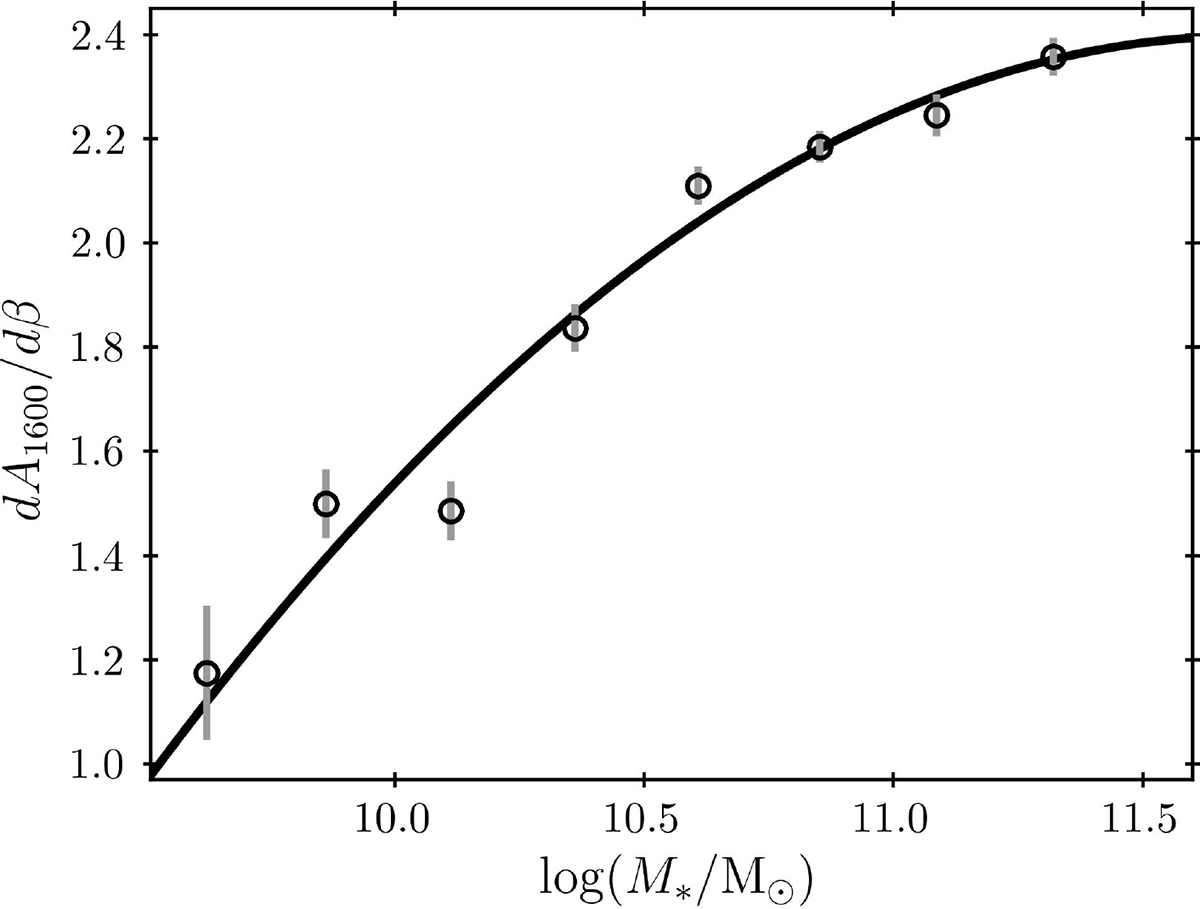
Relationship between the dust reddening slope, dA1600/dβ, and the stellar mass for the sample plotted in Figure 3, where a clear correlation can be seen, with more massive systems being characterized by flatter attenuation curves. The functional form of the relation is derived and discussed in Section 4.2 and summarized in Equation (9).
Current usage metrics show cumulative count of Article Views (full-text article views including HTML views, PDF and ePub downloads, according to the available data) and Abstracts Views on Vision4Press platform.
Data correspond to usage on the plateform after 2015. The current usage metrics is available 48-96 hours after online publication and is updated daily on week days.
Initial download of the metrics may take a while.