


| Issue |
A&A
Volume 711, July 2026
|
|
|---|---|---|
| Article Number | A150 | |
| Number of page(s) | 11 | |
| Section | Extragalactic astronomy | |
| DOI | https://doi.org/10.1051/0004-6361/202659319 | |
| Published online | 09 July 2026 | |
Euclid: A UV-faint quasar in a highly luminous star-forming host galaxy at z ≈ 7.7★
1
Max-Planck-Institut für Astronomie, Königstuhl 17, 69117 Heidelberg, Germany
2
INAF-Osservatorio di Astrofisica e Scienza dello Spazio di Bologna, Via Piero Gobetti 93/3, 40129 Bologna, Italy
3
Leiden Observatory, Leiden University, Einsteinweg 55, 2333 CC, Leiden, The Netherlands
4
Hamburger Sternwarte, University of Hamburg, Gojenbergsweg 112, 21029 Hamburg, Germany
5
INAF-Osservatorio Astronomico di Trieste, Via G. B. Tiepolo 11, 34143 Trieste, Italy
6
INAF-IASF Milano, Via Alfonso Corti 12, 20133 Milano, Italy
7
Institut für Theoretische Physik, University of Heidelberg, Philosophenweg 16, 69120 Heidelberg, Germany
8
Steward Observatory, University of Arizona, 933 N. Cherry Ave, Tucson, AZ 85750, USA
9
Kapteyn Astronomical Institute, University of Groningen, PO Box 800, 9700 AV, Groningen, The Netherlands
10
Department of Physics, University of California, Santa Barbara, CA 93106, USA
11
Research Center for Space and Cosmic Evolution, Ehime University, 2-5 Bunkyo-cho, Matsuyama, Ehime 790-8577, Japan
12
Astrophysics Group, Blackett Laboratory, Imperial College London, London SW7 2AZ, UK
13
Department of Mathematics, Imperial College London, London SW7 2AZ, UK
14
Waseda Institute for Advanced Study (WIAS), Waseda University, 1-21-1, Nishi-Waseda, Shinjuku, Tokyo 169-0051, Japan
15
Kavli Institute for the Physics and Mathematics of the Universe (WPI), University of Tokyo, Kashiwa, Chiba 277-8583, Japan
16
INAF-Istituto di Astrofisica e Planetologia Spaziali, via del Fosso del Cavaliere, 100, 00100 Roma, Italy
17
Jet Propulsion Laboratory, California Institute of Technology, 4800 Oak Grove Drive, Pasadena, CA 91109, USA
18
Department of Astronomy, University of Michigan, 1085 S. University Ave., Ann Arbor, MI 48109, USA
19
Herzberg Astronomy and Astrophysics Research Centre, 5071 W. Saanich Rd., Victoria, BC V9E 2E7, Canada
20
Jodrell Bank Centre for Astrophysics, Department of Physics and Astronomy, University of Manchester, Oxford Road, Manchester M13 9PL, UK
21
Cosmic Dawn Center (DAWN)
22
Instituto de Astrofísica de Canarias, E-38205 La Laguna, Tenerife, Spain
23
Universidad de La Laguna, Dpto. Astrofísica, E-38206 La Laguna, Tenerife, Spain
24
Department of Physics and Astronomy, University of British Columbia, Vancouver, BC V6T 1Z1, Canada
25
School of Physics & Astronomy, University of Southampton, Highfield Campus, Southampton SO17 1BJ, UK
26
Department of Physics, Massachusetts Institute of Technology, Cambridge, MA 02139, USA
27
MIT Kavli Institute for Astrophysics and Space Research, Massachusetts Institute of Technology, Cambridge, MA 02139, USA
28
ESAC/ESA, Camino Bajo del Castillo, s/n., Urb. Villafranca del Castillo, 28692 Villanueva de la Cañada, Madrid, Spain
29
INAF-Osservatorio Astronomico di Brera, Via Brera 28, 20122 Milano, Italy
30
IFPU, Institute for Fundamental Physics of the Universe, via Beirut 2, 34151 Trieste, Italy
31
INFN, Sezione di Trieste, Via Valerio 2, 34127 Trieste TS, Italy
32
SISSA, International School for Advanced Studies, Via Bonomea 265, 34136 Trieste TS, Italy
33
Dipartimento di Fisica e Astronomia, Università di Bologna, Via Gobetti 93/2, 40129 Bologna, Italy
34
INFN-Sezione di Bologna, Viale Berti Pichat 6/2, 40127 Bologna, Italy
35
INAF-Osservatorio Astronomico di Padova, Via dell’Osservatorio 5, 35122 Padova, Italy
36
Department of Physics “E. Pancini”, University Federico II, Via Cinthia 6, 80126 Napoli, Italy
37
INAF-Osservatorio Astronomico di Capodimonte, Via Moiariello 16, 80131 Napoli, Italy
38
Dipartimento di Fisica, Università degli Studi di Torino, Via P. Giuria 1, 10125 Torino, Italy
39
INFN-Sezione di Torino, Via P. Giuria 1, 10125 Torino, Italy
40
INAF-Osservatorio Astrofisico di Torino, Via Osservatorio 20, 10025 Pino Torinese (TO), Italy
41
Centro de Investigaciones Energéticas, Medioambientales y Tecnológicas (CIEMAT), Avenida Complutense 40, 28040 Madrid, Spain
42
Port d’Informació Científica, Campus UAB, C. Albareda s/n, 08193 Bellaterra (Barcelona), Spain
43
Institute for Theoretical Particle Physics and Cosmology (TTK), RWTH Aachen University, 52056 Aachen, Germany
44
Deutsches Zentrum für Luft- und Raumfahrt e. V. (DLR), Linder Höhe, 51147 Köln, Germany
45
INAF-Osservatorio Astronomico di Roma, Via Frascati 33, 00078 Monteporzio Catone, Italy
46
INFN section of Naples, Via Cinthia 6, 80126 Napoli, Italy
47
Institute for Astronomy, University of Hawaii, 2680 Woodlawn Drive, Honolulu, HI 96822, USA
48
Dipartimento di Fisica e Astronomia “Augusto Righi” – Alma Mater Studiorum Università di Bologna, Viale Berti Pichat 6/2, 40127 Bologna, Italy
49
Institute for Astronomy, University of Edinburgh, Royal Observatory, Blackford Hill, Edinburgh EH9 3HJ, UK
50
European Space Agency/ESRIN, Largo Galileo Galilei 1, 00044 Frascati, Roma, Italy
51
Université Claude Bernard Lyon 1, CNRS/IN2P3, IP2I Lyon, UMR 5822, Villeurbanne F-69100, France
52
Aix-Marseille Université, CNRS, CNES, LAM, Marseille, France
53
Institut de Ciències del Cosmos (ICCUB), Universitat de Barcelona (IEEC-UB), Martí i Franquès 1, 08028 Barcelona, Spain
54
Institució Catalana de Recerca i Estudis Avançats (ICREA), Passeig de Lluís Companys 23, 08010 Barcelona, Spain
55
Institut de Ciencies de l’Espai (IEEC-CSIC), Campus UAB, Carrer de Can Magrans, s/n Cerdanyola del Vallés, 08193 Barcelona, Spain
56
UCB Lyon 1, CNRS/IN2P3, IUF, IP2I Lyon, 4 rue Enrico Fermi, 69622 Villeurbanne, France
57
Canada-France-Hawaii Telescope, 65-1238 Mamalahoa Hwy, Kamuela, HI 96743, USA
58
Departamento de Física, Faculdade de Ciências, Universidade de Lisboa, Edifício C8, Campo Grande, PT1749-016 Lisboa, Portugal
59
Instituto de Astrofísica e Ciências do Espaço, Faculdade de Ciências, Universidade de Lisboa, Campo Grande, 1749-016 Lisboa, Portugal
60
Department of Astronomy, University of Geneva, ch. d’Ecogia 16, 1290 Versoix, Switzerland
61
Université Paris-Saclay, CNRS, Institut d’astrophysique spatiale, 91405 Orsay, France
62
INFN-Padova, Via Marzolo 8, 35131 Padova, Italy
63
Aix-Marseille Université, CNRS/IN2P3, CPPM, Marseille, France
64
Space Science Data Center, Italian Space Agency, via del Politecnico snc, 00133 Roma, Italy
65
INFN-Bologna, Via Irnerio 46, 40126 Bologna, Italy
66
Institut d’Estudis Espacials de Catalunya (IEEC), Edifici RDIT, Campus UPC, 08860 Castelldefels, Barcelona, Spain
67
Institute of Space Sciences (ICE, CSIC), Campus UAB, Carrer de Can Magrans, s/n, 08193 Barcelona, Spain
68
School of Physics, HH Wills Physics Laboratory, University of Bristol, Tyndall Avenue, Bristol BS8 1TL, UK
69
University Observatory, LMU Faculty of Physics, Scheinerstr. 1, 81679 Munich, Germany
70
Max Planck Institute for Extraterrestrial Physics, Giessenbachstr. 1, 85748 Garching, Germany
71
Universitäts-Sternwarte München, Fakultät für Physik, Ludwig-Maximilians-Universität München, Scheinerstr. 1, 81679 München, Germany
72
Dipartimento di Fisica “Aldo Pontremoli”, Università degli Studi di Milano, Via Celoria 16, 20133 Milano, Italy
73
INFN-Sezione di Milano, Via Celoria 16, 20133 Milano, Italy
74
Institute of Theoretical Astrophysics, University of Oslo, P.O. Box 1029 Blindern, 0315 Oslo, Norway
75
Department of Physics, Lancaster University, Lancaster LA1 4YB, UK
76
Felix Hormuth Engineering, Goethestr. 17, 69181 Leimen, Germany
77
Technical University of Denmark, Elektrovej 327, 2800 Kgs. Lyngby, Denmark
78
Cosmic Dawn Center (DAWN), Denmark
79
NASA Goddard Space Flight Center, Greenbelt, MD 20771, USA
80
Department of Physics and Astronomy, University College London, Gower Street, London WC1E 6BT, UK
81
Université de Genève, Département de Physique Théorique and Centre for Astroparticle Physics, 24 quai Ernest-Ansermet, CH-1211 Genève 4, Switzerland
82
Department of Physics, P.O. Box 64, University of Helsinki, 00014 Helsinki, Finland
83
Helsinki Institute of Physics, Gustaf Hällströmin katu 2, University of Helsinki, 00014 Helsinki, Finland
84
Laboratoire d’etude de l’Univers et des phenomenes eXtremes, Observatoire de Paris, Université PSL, Sorbonne Université, CNRS, 92190 Meudon, France
85
SKAO, Jodrell Bank, Lower Withington, Macclesfield SK11 9FT, UK
86
Centre de Calcul de l’IN2P3/CNRS, 21 avenue Pierre de Coubertin, 69627 Villeurbanne Cedex, France
87
University of Applied Sciences and Arts of Northwestern Switzerland, School of Computer Science, 5210 Windisch, Switzerland
88
Universität Bonn, Argelander-Institut für Astronomie, Auf dem Hügel 71, 53121 Bonn, Germany
89
INFN-Sezione di Roma, Piazzale Aldo Moro, 2 - c/o Dipartimento di Fisica, Edificio G. Marconi, 00185 Roma, Italy
90
Dipartimento di Fisica e Astronomia “Augusto Righi” – Alma Mater Studiorum Università di Bologna, via Piero Gobetti 93/2, 40129 Bologna, Italy
91
Department of Physics, Institute for Computational Cosmology, Durham University, South Road, Durham DH1 3LE, UK
92
Université Paris Cité, CNRS, Astroparticule et Cosmologie, 75013 Paris, France
93
CNRS-UCB International Research Laboratory, Centre Pierre Binétruy, IRL2007, CPB-IN2P3 Berkeley, USA
94
University of Applied Sciences and Arts of Northwestern Switzerland, School of Engineering, 5210 Windisch, Switzerland
95
Institute of Physics, Laboratory of Astrophysics, Ecole Polytechnique Fédérale de Lausanne (EPFL), Observatoire de Sauverny, 1290 Versoix, Switzerland
96
Telespazio UK S.L. for European Space Agency (ESA), Camino bajo del Castillo, s/n, Urbanizacion Villafranca del Castillo, Villanueva de la Cañada, 28692 Madrid, Spain
97
Institut de Física d’Altes Energies (IFAE), The Barcelona Institute of Science and Technology, Campus UAB, 08193 Bellaterra (Barcelona), Spain
98
School of Mathematics and Physics, University of Surrey, Guildford, Surrey GU2 7XH, UK
99
European Space Agency/ESTEC, Keplerlaan 1, 2201 AZ, Noordwijk, The Netherlands
100
DARK, Niels Bohr Institute, University of Copenhagen, Jagtvej 155, 2200 Copenhagen, Denmark
101
Waterloo Centre for Astrophysics, University of Waterloo, Waterloo, Ontario N2L 3G1, Canada
102
Department of Physics and Astronomy, University of Waterloo, Waterloo, Ontario N2L 3G1, Canada
103
Perimeter Institute for Theoretical Physics, Waterloo, Ontario N2L 2Y5, Canada
104
Université Paris-Saclay, Université Paris Cité, CEA, CNRS, AIM, 91191 Gif-sur-Yvette, France
105
Centre National d’Etudes Spatiales – Centre spatial de Toulouse, 18 avenue Edouard Belin, 31401 Toulouse Cedex 9, France
106
Institute of Space Science, Str. Atomistilor, nr. 409 Măgurele, Ilfov 077125, Romania
107
Dipartimento di Fisica e Astronomia “G. Galilei”, Università di Padova, Via Marzolo 8, 35131 Padova, Italy
108
Caltech/IPAC, 1200 E. California Blvd., Pasadena, CA 91125, USA
109
Institut de Recherche en Astrophysique et Planétologie (IRAP), Université de Toulouse, CNRS, UPS, CNES, 14 Av. Edouard Belin, 31400 Toulouse, France
110
Université St Joseph; Faculty of Sciences, Beirut, Lebanon
111
Departamento de Física, FCFM, Universidad de Chile, Blanco Encalada 2008, Santiago, Chile
112
Universität Innsbruck, Institut für Astro- und Teilchenphysik, Technikerstr. 25/8, 6020 Innsbruck, Austria
113
Department of Physics and Helsinki Institute of Physics, Gustaf Hällströmin katu 2, University of Helsinki, 00014 Helsinki, Finland
114
Instituto de Astrofísica e Ciências do Espaço, Faculdade de Ciências, Universidade de Lisboa, Tapada da Ajuda, 1349-018 Lisboa, Portugal
115
Mullard Space Science Laboratory, University College London, Holmbury St Mary, Dorking, Surrey RH5 6NT, UK
116
Niels Bohr Institute, University of Copenhagen, Jagtvej 128, 2200 Copenhagen, Denmark
117
Universidad Politécnica de Cartagena, Departamento de Electrónica y Tecnología de Computadoras, Plaza del Hospital 1, 30202 Cartagena, Spain
118
Instituto de Física Teórica UAM-CSIC, Campus de Cantoblanco, 28049 Madrid, Spain
119
Aurora Technology for European Space Agency (ESA), Camino bajo del Castillo, s/n, Urbanizacion Villafranca del Castillo, Villanueva de la Cañada, 28692 Madrid, Spain
120
Dipartimento di Fisica - Sezione di Astronomia, Università di Trieste, Via Tiepolo 11, 34131 Trieste, Italy
121
Institut d’Astrophysique de Paris, 98bis Boulevard Arago, 75014 Paris, France
122
ICL, Junia, Université Catholique de Lille, LITL, 59000 Lille, France
123
ICSC – Centro Nazionale di Ricerca in High Performance Computing, Big Data e Quantum Computing, Via Magnanelli 2, Bologna, Italy
★★ Corresponding author: This email address is being protected from spambots. You need JavaScript enabled to view it.
Received:
4
February
2026
Accepted:
15
May
2026
Abstract
Constraining the co-evolution of supermassive black holes and their host galaxies in the first billion years after the Big Bang is essential for understanding the formation of the earliest cosmic structures. Here, we present IRAM/NOrthern Extended Millimeter Array (NOEMA) observations of the z ≈ 7.7 quasar EUCL J125308.55+705432.3, recently discovered in the first data release of the Euclid Wide Survey. We report the most distant detections of [C II] 158 μm and cold dust emission in a quasar host to date. The [C II] emission line sets the systemic redshift at z = 7.6980 ± 0.0004. The source exhibits luminosities of LFIR = 3.6 × 10¹² L⊙ and L[C II] = 2 × 10⁹ L⊙, respectively, a dust mass of 1.4 × 10⁸ M⊙, and a dynamical mass in the range 0.33 − 1.3 × 10¹⁰ M⊙. Remarkably, despite being nearly two magnitudes fainter in the rest-frame UV (M1450 = −24.06) than previously known z ≈ 7.5 quasars (⟨M1450⟩ ∼ − 26.5), EUCL J125308.55+705432.3 exhibits the brightest [C II] emission among them. This indicates that the host galaxy is actively star-forming, with a star-formation rate > 250 M⊙ yr−1, consistent with recent findings that UV-faint quasars at z > 6 preferentially reside in [C II]-luminous galaxies. The UV-faintness likely reflects dust obscuration or sub-Eddington accretion, rather than lower host mass, suggesting these systems are at a different stage in their evolution compared to UV-bright quasars. These IRAM/NOEMA observations highlight the power of combining Euclid’s wide-area quasar discovery potential with submillimetre follow-up observations to characterise the host galaxies of early supermassive black holes across a broader redshift and luminosity range than previously accessible.
Key words: ISM: general / galaxies: active / galaxies: high-redshift / quasars: individual: EUCL J125308.55+705432.3
This paper is published on behalf of the Euclid Consortium.
© The Authors 2026
 Open Access article, published by EDP Sciences, under the terms of the Creative Commons Attribution License (https://creativecommons.org/licenses/by/4.0), which permits unrestricted use, distribution, and reproduction in any medium, provided the original work is properly cited.
This article is published in open access under the Subscribe to Open model.
Open access funding provided by Max Planck Society.
1. Introduction
The most distant quasars, residing at the epoch of reionisation (EoR, at redshift z > 6), can serve as powerful probes of early Universe conditions. They provide essential benchmarks for models of supermassive black hole (SMBH) formation and growth, galaxy assembly, large-scale structure evolution, along with the history of cosmic reionisation and chemical enrichment of the intergalactic medium (see Fan et al. 2023, for a recent review). To date, only three systems at z ≈ 7.5 anchor the current quasar redshift frontier (Bañados et al. 2018; Yang et al. 2020; Wang et al. 2021). These UV-bright (⟨M1450⟩ ≃ −26.5) sources harbour SMBHs with masses exceeding 109 M⊙ (e.g. Yang et al. 2021; Bosman et al. 2025), challenging our understanding of how such massive objects could assemble within the first 700 million years of the Universe’s existence (e.g. Inayoshi et al. 2020).
The accreting SMBH injects large amounts of energy into the surrounding medium, influencing gas dynamics and star formation within the host galaxy and thereby regulating its dynamical properties and baryonic content (e.g. Di Matteo et al. 2005; Hopkins et al. 2008). Probing the SMBH–galaxy relation at the highest redshift strongly benefit from submillimetre observations with the Atacama Large Millimeter/submillimeter Array (ALMA) and/or the NOrthern Extended Millimeter Array (NOEMA), which provide key diagnostics of the interstellar medium (ISM).
All three known quasars at z ≈ 7.5 have been observed with ALMA and/or NOEMA to investigate their host galaxies (Venemans et al. 2017a; Bañados et al. 2019; Novak et al. 2019; Yang et al. 2020; Wang et al. 2021; Feruglio et al. 2023; Wang et al. 2024; Salvestrini et al. 2025). These studies, together with similar efforts on lower redshift sources (e.g. Decarli et al. 2018; Venemans et al. 2018, 2020; Neeleman et al. 2021; Izumi et al. 2021b; Yue et al. 2021; Bañados et al. 2024), reveal that early quasar host galaxies share several remarkable properties: (i) they are gas-rich systems undergoing vigorous star formation, with star-formation rates (SFRs) ranging from 50 to 1000 M⊙ yr−1; (ii) they are bright in the far-infrared (FIR), with luminosities of LFIR ≈ 1012 − 13 L⊙, indicative of intense dust heating driven by elevated SFRs; (iii) the inferred dust temperatures (30–60 K) and dust masses (≳108 M⊙) suggest the presence of massive molecular gas reservoirs; (iv) these systems exhibit strong [C II] 158 μm emission, a principal coolant of the ISM that directly traces both star formation activity and the kinematics of atomic and ionised gas (e.g. Díaz-Santos et al. 2016; v) their [C II]/FIR luminosity ratios are consistent with those found in high-redshift starbursts and local ultraluminous infrared galaxies (ULIRGs), reflecting the combined influence of accretion-powered heating and star formation in shaping ISM conditions; (vi) high-resolution [C II] imaging on scales of about 200–300 pc reveals rotating gas discs with compact, structures. Kinematic modelling of these high-resolution data suggests that the most luminous systems harbour overmassive SMBHs relative to expectations from the local M–σ★ relation; and (vii) the detection of dust-rich companion galaxies near to the central quasar points to galaxy-rich environments at early cosmic times, implying that major mergers may have played a key role in fuelling the rapid growth of both SMBHs and their host galaxies.
Despite the availability of extensive studies, the rapid co-evolution of massive galaxies and their central SMBHs remains poorly understood, particularly in terms of the properties, dynamics, and fuelling efficiency of their molecular gas. While the three quasars discovered at z ≈ 7.5 have provided crucial insights into this epoch, this small sample limits our ability to constrain early galaxy and black hole assembly models at the redshifts where they are most discriminating. The Euclid mission (Euclid Collaboration: Mellier et al. 2025) is dramatically expanding this sample, having identified 31 new quasars at 6.6 ≤ z ≤ 7.8 in its first 1.5 year, more than doubling the number of known z > 7 quasars (Yang et al. 2026).
Among these discoveries is EUCL J125308.55+705432.3 (hereafter EUCL J1253+7054) at z ≈ 7.7, the second most distant quasar known to date and the focus of this paper. Remarkably, EUCL J1253+7054 is nearly two magnitudes fainter in in the rest-frame UV (M1450 = −24.06) than the previous known z ≈ 7.5 quasars, demonstrating Euclid’s ability to probe the uncharted territory of UV-faint quasars at z > 7. On the other hand EUCL J1253+7054 is also an order magnitude brighter in the UV than the brightest (⟨M1450⟩ ≈ − 22) high-redshift galaxies discovered so far (e.g. Bouwens et al. 2022; Matsuoka et al. 2025; Roberts-Borsani et al. 2024, 2025, but see also Yang et al. 2026).
Such UV-faint (M1450 ≳ −24) quasars as EUCL J1253+7054 could represent an important link between the most luminous quasars (M1450 ≈ −26) and the fainter (M1450 ≈ −20) broad-line active galactic nuclei (AGNs) commonly detected by the James Webb Space Telescope (JWST) in the EoR (e.g. Harikane et al. 2023; Maiolino et al. 2024; Schindler et al. 2025). At this intermediate luminosity, we probe a regime where the AGN still dominates the total luminosity budget, but the central quasar is not outshining the host galaxy as severely as in the most luminous systems (e.g. Ding et al. 2025). Moreover, this magnitude range represents a transition zone where the UV luminosity functions of quasars and star-forming galaxies begin to overlap (e.g. Matsuoka et al. 2023), making UV-faint quasars a crucial link for understanding the evolution of both populations.
In this paper, we report the most distant [C II] and cold dust observations of a quasar host galaxy to date, obtained with IRAM/NOEMA, and we characterise the properties of the EUCL J1253+7054 system. For full details on the selection, discovery and optical/NIR properties of EUCL J1253+7054, we refer to Yang et al. (2026).
The paper is structured as follows. In Sect. 2, we describe the observations and the data reduction. In Sect. 3, we report and discuss our results on the [C II] and dust continuum properties, SFR, and mass content of this luminous host galaxy. In Sect. 4, we summarise our findings.
The magnitudes reported in this work are all in the AB system. Throughout the paper, we use a flat Λ cold dark matter (ΛCDM) cosmology with H0 = 70 km s−1 Mpc−1, Ωm = 0.3, and ΩΛ = 0.7. All uncertainties are reported at the level of 1σ.
2. NOEMA observations and data reduction
We observed EUCL J1253+7054 in two visits, on 26 and 31 March, 2025, as part of the program E24AH (PIs: Decarli and Belladitta). The NOEMA array was in 12B configuration (resolution ∼0 45) on 26 March and in 12C configuration (resolution ∼0
 85) on 31 March. The quasar 1044+719 served as phase and amplitude calibrator and MWC349 was observed as absolute flux calibrator. The quasars 3C273, 1448+762 and 0851+202 served as ancillary calibrators for bandpass and flux. The target was always observed at altitude > 45°. The system temperature was 150–250 K on 26 March, and 100–140 K on 31 March. The precipitable water vapour column was about 3 mm during the first visit, and 1.2 mm during the second visit.
We calibrated the data using standard procedures, using the pipeline in the clic software offered within the Grenoble Image and Line Data Analysis Software (GILDAS1; Gildas Team 2013) suite. Only a small fraction of visibilities (< 25%, mostly from the longer baseline data obtained on 26 March) were flagged due to poor phase residuals. The calibrated dataset includes 22 200 visibilities on source, corresponding to 4.20 hours (12 antennas equivalent). We processed the upper sideband (USB; 229.9–237.6 GHz) and lower sideband (LSB; 214.3–222.1 GHz) independently. For the [C II] line analysis, we created a spectral cube from the LSB data, resampling the spectral axis in bins of 30 km s−1. As the USB is entirely free of line contamination, we produced a continuum image using all available USB channels. We note that the USB and LSB datasets (and their associated uv-tables) were kept separate throughout the analysis, and no combined USB+LSB continuum map was produced. Imaging was performed using uvmap in the mapping software. The resulting USB continuum map (left panel of Fig. 1) has a beam size of 1 05 × 0
 66, PA = 18 deg, and rms of 0.05 mJy beam−1.
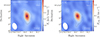 |
Fig. 1. 0 |


We created a continuum-subtracted [C II] emission line cube using the uv_subtract task in mapping. The line map was obtained by using the uv_average task in mapping, and averaging over the range 218.364–218.814 GHz for a total width of 420 km s−1, which corresponds to 1.9×FWHM (see Table 1). We show the [C II] continuum-subtracted moment-0 map (rms = 0.20 mJy beam−1, beam size = 1 1 × 0
1 × 0 7, PA = 17 deg) in the right panel of Fig. 1.
Observed and derived properties of EUCL J1253+7054.
The following sections present our primary analysis conducted in the image plane. In addition, a complementary visibility-based analysis is provided in Sect. 3.3 as a consistency check.
3. Results and discussion
3.1. [CII] line measurements
From the LSB data cube, we extracted the one-dimensional (1D) spectrum for the source in an aperture centred on the quasar position (Novak et al. 2019; Rojas-Ruiz et al. 2021). We determined the best aperture following Mazzucchelli et al. (2025) by extracting the flux of the quasar in concentric apertures from 0 1 to 3
 0 (in steps of 0
 1) and choosing the radius at which the flux encounters a plateau. The best aperture found was
  . We then fit the spectrum with a flat dust continuum emission and a Gaussian line. The extracted spectrum is shown in Fig. 2 and we report the best fit values in Table 1.
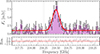 |
Fig. 2. NOEMA spectrum of the [C II] emission line in EUCL J1253+7054 (observed frame) obtained from the 30 km s−1 data cube. The red solid curve is the fit to the data consisting of a single Gaussian component plus continuum. A few channels close to the border of the sub-bands, near 218.25 GHz have been masked (vertical grey lines). The bottom panel displays the residuals (data − model), with the dashed line marking the zero level. |
As shown in Fig. 2, a single Gaussian component provides an excellent fit to the [C II] line profile, yielding a reduced χν2 ≈ 0.89. We inspected the residuals for any systematic deviations that might indicate the presence of broad wings, which could trace outflowing gas. The residual spectrum is consistent with Gaussian noise across the entire line profile, with no evidence for additional components. To further quantify this result, we performed a formal model comparison using the Bayesian information criterion (BIC) to test for the presence of a second Gaussian component. The double-Gaussian model was shown to be disfavoured by the data, yielding a ΔBIC = 14.9 relative to the single-component fit. Consequently, we adopted a single Gaussian profile as the sufficient and preferred model for the [C II] emission.
The Gaussian fit on the 1D spectrum yields a [C II]-based redshift of 7.6980 ± 0.0004. We estimated the [C II] line luminosity from the measured integrated line flux density following Carilli & Walter (2013),
![Mathematical equation: $$ \begin{aligned} \frac{L_{{\text{[C}}{\small { {\text{ II]}}}}}}{{L_{\odot }}} = 1.04 \times 10^{-3} \frac{F_\mathrm{line} }{\mathrm{Jy\,km\,s^{-1}}} \frac{\nu _\mathrm{obs} }{\mathrm{GHz}} \left(\frac{D_\mathrm{L} }{\mathrm{Mpc}}\right)^2, \end{aligned} $$](/articles/aa/full_html/2026/07/aa59319-26/aa59319-26-eq21.gif) (1)
(1)
where νobs is the observed frequency of the line and DL is the luminosity distance.
The line flux derived from the 1D Gaussian fit of the spectrum in Fig. 2 is 1.51 Jy km s−1 (Table 1). This value is consistent with that derived from a 2D Gaussian fit performed with the task IMFIT of the Common Astronomy Software Applications package (CASA, McMullin et al. 2007), which yields an integrated flux density of (3.80 ± 0.35) mJy, corresponding to (1.59 ± 0.15) Jy km s−1 when multiplying by the 420 km s−1 channel width used to create the line map (Sect. 2). It is also consistent within 1σ with the [C II] flux density obtained from uv-plane fit (Sect. 3.3). From the [C II] flux and Eq. (1) we derive a luminosity (L[C II]) of 2.03
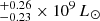 , making EUCL J1253+7054 the brightest [C II] emitter among the known quasars at z ≈ 7.5 (Venemans et al. 2017a; Yang et al. 2020; Wang et al. 2021). The IMFIT task indicates that the emission is marginally resolved, though with large uncertainties. The derived deconvolved [C II] radius is R[C II] = (1.69 ± 0.45) kpc. This value is consistent with those obtained by performing a Gaussian fitting directly in the uv-plane: (1.07 ± 0.15) kpc (see Sect. 3.3.) However, since the uv-plane analysis provides a more precise constraint (i.e. smaller uncertainty), we adopted this value as the reference for the dynamical mass calculation (see Sect. 3.6).
We also computed the rest-frame equivalent width (EW), defined as the ratio between the flux of the line and the flux density of the continuum, finding a value of 1330 km s−1 (0.70
 μm). This is consistent with the majority of the values of other z > 7 quasars (e.g. Wang et al. 2024).
Figure 3 presents the continuum-subtracted [C II] channel maps at 30 km s−1 resolution, which reveal the velocity structure of the source. The emission is concentrated within the central velocity channels, suggesting that the quasar host is not part of a merging or interacting system, unlike other z > 6 quasars (e.g. Decarli et al. 2017; Bañados et al. 2019; Neeleman et al. 2021; Izumi et al. 2021b, 2024). We note a tentative southern extension at ∼3σ significance in the 84 km s−1 channel map, although this feature is present in only a single velocity channel. While this could indicate a substructure at this velocity, consistent with the source being marginally resolved, deeper and higher angular-resolution observations are needed to better constrain its kinematic properties.
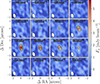 |
Fig. 3. 30 km s−1 [C II] channel maps of the continuum-subtracted data of EUCL J1253+7054. Each channel is labelled with its central velocity. The central black cross indicates the NIR position (same as Fig. 1). Contours are plotted starting from 3σ, with steps of 1σ, where σ is the noise in each individual channel. The synthesised beam is shown in the lower left corner of each panel. North is up, east is left. |
3.2. Continuum measurements
We derive the flux density of the continuum at 1.3 mm (observed frame) from both the 1D spectral fit and the 2D fit of the continuum map. The 2D Gaussian fit on the USB continuum map was performed with CASA/IMFIT. We obtain an integrated flux density of (1.17 ± 0.09) mJy, consistent with the value computed from the 1D fit on the LSB data cube (see Table 1) and a peak flux density of (0.70 ± 0.05) mJy beam−1. The derived continuum flux is consistent within 1σ with the value obtained from fitting directly in the uv-plane (Sect. 3.3).
In addition to the extraction of the flux density, we also find the following results: (i) the coordinates of the 1.3 mm continuum emission (RA = 12h53m8 5409, Dec =
  ) are only 0
 06 from the coordinates based on the Euclid NISP (Euclid Collaboration: Jahnke et al. 2025) JE-band image (Yang et al. 2026), which is within the astrometric uncertainty of NOEMA; and (ii) the uv-plane analysis (Sect. 3.3) indicates that the source is resolved, with a measured full width at half power of
  (assuming a circular Gaussian profile). This is consistent with the image-plane estimates, where the ratio between integrated and peak flux densities (∼1.7) suggests that the emission is spatially extended.
To infer the IR luminosity, we modelled the dust continuum emission as a modified black body (MBB) with a dust temperature of Tdust = 47 K and an emissivity index of β = 1.6 (e.g. Beelen et al. 2006). We adopted these fiducial values following the standard approach used in submm studies of high redshift quasars (e.g. Bañados et al. 2015; Decarli et al. 2018; Novak et al. 2019; Venemans et al. 2018; Khusanova et al. 2022; Mazzucchelli et al. 2025), ensuring our results are directly comparable with the literature. This choice is also consistent with the median Tdust = (48 ± 3) K derived by Costa et al. (2026) from detailed SED fitting to a sample of 11 high-redshift quasars with well-sampled photometry. Similarly, our adopted β = 1.6 is consistent with empirical measurements of β = (1.8 ± 0.3) reported by Witstok et al. (2023) for high-redshift objects.
Given the high redshift nature of EUCL J1253+7054, we also take into account the effect of the cosmic microwave background (CMB) using the correction prescription of da Cunha et al. (2013). We also assumed the opacity law of Dunne et al. (2000): kν = 0.77[ν/(352$GHz)]β cm2 g−1. We then computed the IR luminosities by integrating the MBB function between different frequencies: LFIR from 60 to 100 μm (Helou et al. 1988) and LTIR from 8 to 1000 μm (e.g. Sanders et al. 2003). The results are reported in Table 1. We note that these results, as well as the derived SFR (see Sect. 3.5) and [C II] deficit (see Sect. 3.4) values, are sensitive to the adopted values of Tdust and β, which are known to differ in high-z sources (e.g. Leipski et al. 2013; Venemans et al. 2018; Tripodi et al. 2023; Izumi et al. 2024). Assuming the range of dust parameters explored by Costa et al. (2026) in their analysis of a sample of 11 high-redshift quasars (Tdust = 34–65 K and β = 2.0–2.2), we find that the values we report vary by factors of ≈2 − 5; however, they still remain consistent with those typically observed in the high-redshift quasar population. We further tested the impact of optical depth, τ, effects by adopting an optically thick modified blackbody model. Well-sampled submm SED fits have revealed that z > 6 quasars can have non-negligible dust optical depths, with values reaching ≈0.5 (e.g. Decarli et al. 2023; Costa et al. 2026). As an illustrative case, we assumed τ = 1 at the rest frame frequency of the [C II] line and found that the inferred IR luminosities decrease by a factor of ≈2.6, while the dust mass (reported in Sect. 3.6) increased by ≈0.2 dex. Venemans et al. (2018) found similar variations when performing comparable tests. These variations propagate to derived quantities such as SFRIR and the [C II] deficit, but the resulting values remain well within the range observed for high-z quasar host galaxies. This indicates that the uncertainties on the derived parameters are dominated by systematic effects, rather than by statistical errors.
3.3. UV-plane analysis of the continuum and [CII] line emission
For completeness, we report here the results of Gaussian fitting performed directly in the uv-plane using the uv_fit task in GILDAS, adopting a circular Gaussian profile. We present the flux densities of the 1.3 mm continuum and the [C II] line emission, as well as the source size derived from the [C II] emission.
We obtained a [C II] integrated flux density of F[CII] = (3.56 ± 0.25) mJy, which corresponds to (1.49 ± 0.10) Jy km s−1, and a continuum flux density of Fν (cont.) = (1.06 ± 0.06) mJy. From the uv-plane fit, we derived a [C II] FWHM of  , corresponding to a physical diameter of (2.14 ± 0.30) kpc (radius 1.07 ± 0.15 kpc) at z = 7.698. All measurements are consistent within 1σ with the values derived from the image-plane analysis (Sects. 3.1 and 3.2), confirming our results.
3.4. [CII] deficit
The [C II]/IR luminosity ratio serves as a diagnostic of ISM properties, and this ratio typically ranges from 0.003 to 0.01 in local star-forming galaxies with modest dust temperatures and luminosities (see Hodge & da Cunha 2020, for a recent review). However, this ratio systematically decreases by up to an order of magnitude in more IR-luminous systems (LIR > 1011 L⊙), such as LIRGs and ULIRGs, a phenomenon known as the [C II] deficit (e.g. Farrah et al. 2013; Díaz-Santos et al. 2017). Similar deficits have been observed in other FIR lines, including [OI] 63.2 μm, [OI] 145 μm, and [NII] 122 μm, leading to the broader term ‘FIR line deficit’ (Graciá-Carpio et al. 2011). The physical origin of this trend is still debated (see Decarli & Díaz-Santos 2025, for a recent review), and is not simply a function of IR luminosity or redshift (e.g. Magdis et al. 2014). Several proposed explanations include AGN-driven ionisation of C+ (e.g. Langer & Pineda 2015), self-absorption in dense environments (e.g. Díaz-Santos et al. 2017), thermal saturation under intense far-UV radiation (e.g. Rybak et al. 2019), and optically thick [C II] emission associated with compact, high-temperature dust (e.g. Casey et al. 2014).
The [C II] deficit of EUCL J1253+7054 (L[C II]/LTIR = 4.2 × 10⁻⁴) is shown in Fig. 4. This is in line with the behaviour of the high-z quasar population and local IR-luminous galaxies, which display L[C II]/LTIR ratios ranging from ULIRG-like values to those of normal star-forming galaxies. This indicates that the [C II] deficit is not strongly affected by the presence of a luminous active black hole (e.g. Magdis et al. 2014; Díaz-Santos et al. 2013; Decarli et al. 2018; Decarli & Díaz-Santos 2025; Venemans et al. 2020; Wang et al. 2024). We note that varying Tdust and β (see Sect. 3.2) changes the inferred [C II] deficit by factors of ≈5 (lower) to ≈1.5 (higher) relative to our fiducial assumptions. However, all cases remain consistent with the [C II] deficit observed for high-redshift quasars and luminous IR sources.
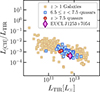 |
Fig. 4. [C II]-to-IR luminosity ratio as a function of IR luminosity for EUCL J1253+7054, compared with measurements from the literature: high-redshift quasars are from Wang et al. (2024) and Bouwens et al. (2025), while the compilation of galaxies is from Decarli & Díaz-Santos (2025) and include ULRIGs, Submillimeter galaxies, optically selected galaxies (primarily Lyman-break galaxies and Ly−α emitters) starbursts, main-sequence galaxies (see Decarli & Díaz-Santos 2025, for all the details). |
The observed [C II] deficit in EUCL J1253+7054 provides insights beyond strictly what the morphological analysis alone can reveal. Herrera-Camus et al. (2018) demonstrated that at a fixed IR luminosity, the [C II]/IR ratio decreases as galaxies become more compact. Our measured [C II]/IR ratio of 4.2 × 10⁻⁴, combined with the high FIR luminosity, suggests that EUCL J1253+7054 is compact, with high-surface-density star formation.
The x-axis of Fig. 4 shows that EUCL J1253+7054 exhibits the highest IR continuum luminosity among the three z > 7.5 known quasars, though comparable to J1007+2115 (Wang et al. 2024). However, unlike the [C II] luminosity, which is a robust measurement, IR luminosities are more model-dependent due to assumptions about dust temperature and emissivity (see Sect. 3.2).
3.5. Star-formation rate
We can use both the luminosity from the [C II] line and the dust continuum to infer the SFR of the host galaxy of EUCL J1253+7054. We followed the methodology reported in e.g. Decarli et al. (2018) and Mazzucchelli et al. (2023). Compared to the IR luminosity, [C II] offers key observational advantages: it is bright and readily detectable, ubiquitous in galaxies, facilitates accurate redshift measurements, and is rarely saturated except in dense starburst nuclei. However, the [C II] deficit in luminous sources and its metallicity dependence limit its reliability as an SFR tracer for very bright, compact starbursts and metal-poor systems (e.g. De Looze et al. 2014; Herrera-Camus et al. 2015, hereafter DL14 and HC15). Conversely, dust continuum photometry enables SFR estimates without precise redshift information (Kennicutt & Evans 2012), but requires sampling near the SED peak (∼100 μm rest-frame), which is observationally challenging from the ground due to poor atmospheric transmission below 500 GHz.
In this case, we can use the equation from Kennicutt & Evans (2012) to estimate the dust-based SFR (SFRIR) via
 (2)
(2)
where the IR luminosity (LIR) is computed between 3 and 1100 μm. The Kennicutt & Evans (2012) relation assumes that the FIR emission is primarily powered by star formation. This approach is consistent with observational studies of high-z quasars (e.g. Barnett et al. 2015; Decarli et al. 2023; Costa et al. 2026) which find that cold dust emission in z > 6 quasar hosts is aptly modelled by intense starburst activity. However, we note that the presence of a powerful AGN may provide an additional heating source for the dust. While several studies have found this contribution to be minor in the FIR (e.g. Leipski et al. 2014; Venemans et al. 2017b; Neeleman et al. 2019; Li et al. 2022), some theoretical models suggest the central SMBH could contribute a non-negligible fraction of the IR luminosity (e.g. Schneider et al. 2015). In such a scenario, our IR-based SFR would be overestimated.
We computed the [C II]-based SFR (SFR[C II]) from the relation reported in Eq. (17) of DL14, calibrated on z = 0.5–6.6 galaxies with a scatter of about 0.4 dex, via
![Mathematical equation: $$ \begin{aligned} \frac{\mathrm {SFR}_{{\text{[C}}{\small {{\text{ II]}}}}}}{{M_{\odot }}\,\mathrm {yr}^{-1}} = 3\times 10^{-9} \left( \frac{L_{{\text{[C}}{\small {{\text{ II]}}}}}}{{L_{\odot }}} \right)^{1.18}. \end{aligned} $$](/articles/aa/full_html/2026/07/aa59319-26/aa59319-26-eq32.gif) (3)
(3)
We obtained SFRIR = (715 ± 53) M⊙ yr−1 and SFR[C II],DL14 = 289 . These estimates are also listed in Table 1. These values are in line with the SFRs of z > 6 quasars reported in the literature using the same estimators (e.g. Venemans et al. 2017a; Yang et al. 2020; Wang et al. 2024).
The [C II]-based SFR is commonly observed to be lower than the FIR-based SFR in FIR-luminous quasar host galaxies at z > 6 (e.g. Wang et al. 2024). This discrepancy arises because the empirical relation from DL14 was calibrated on typical star-forming galaxies, whereas FIR-luminous galaxies exhibit a significant [C II] deficit at high luminosities (see Sect. 3.4). HC15 provided a relation for deriving the SFR from the [C II] luminosity that accounts for the [C II] deficit via
![Mathematical equation: $$ \begin{aligned} \frac{\mathrm{SFR}_{[\mathrm{C}\,{ii }]}}{{M_{\odot }}\,\mathrm{yr}^{-1}} = 0.052 \left( \frac{L_{[\mathrm{C}\,{ii }]}\,\Psi (y)}{10^{40}\,\mathrm{erg}\,\mathrm{s}^{-1}} \right)^{1.034}, \end{aligned} $$](/articles/aa/full_html/2026/07/aa59319-26/aa59319-26-eq34.gif) (4)
(4)
where Ψ(y) = (y/yt)α is a colour adjustment coefficient dependent on dust temperature, with y = νFν(70 μm)/νFν(160 μm), yt = 1.12 and α = 1.2 (see HC15 for details). Applying this equation, we derived SFR[C II],HC15 = 644 , which is in good agreement with the FIR-based estimate.
3.6. Mass budget: Mdust, Mgas, Mdyn, and MBH
The dust mass, Mdust, is typically derived by scaling the observed continuum flux density to a MBB template normalised to 1 M⊙ of dust, following the standard optically thin assumption whereby the dust emission is directly proportional to dust mass (e.g. da Cunha et al. 2013). We employed the same method and assumptions described in Sect. 3.2 (i.e. Tdust = 47 K and β = 1.6), finding a value of log10(Mdust/M⊙) = 8.14 ± 0.03, which is consistent with the dust mass values derived for several quasars at z > 6.5 (e.g. Wang et al. 2024).
Dust emission can also be used as a molecular gas tracer. By assuming a gas-to-dust ratio, δGDR, of 100, which is a value that yields consistent results across different gas-mass tracers (e.g. Decarli et al. 2022; Kaasinen et al. 2024), and a molecular-to-total gas mass fraction of 0.75 (e.g. Neeleman et al. 2021; Decarli et al. 2023), we can roughly estimate the molecular gas mass (Mgas) to be around 1010 M⊙.
We caution that the gas mass estimate is sensitive to the assumed δGDR, which is an uncertain quantity (e.g. Feruglio et al. 2023; Tripodi et al. 2024). Adopting the range δGDR = (80 ± 40) (Salvestrini et al. 2025), the molecular gas mass varies between ≈4.1 × 10⁹ M⊙ and ≈1.2 × 10¹⁰ M⊙.
Combining the molecular gas mass with the SFR derived from the IR luminosity, we obtained a gas depletion time of ≈8 − 20 Myr, in line with values reported for other z > 6 quasar hosts (e.g. Kaasinen et al. 2024; Tripodi et al. 2024). This suggest that the host galaxy of EUCL J1253+7054 is undergoing an extreme starburst phase, as commonly observed in IR-luminous z > 6 quasar hosts.
From these NOEMA observations, we can also derive a first estimate of the dynamical mass (Mdyn) of the system. In our case, the FIR continuum and [C II] emission of EUCL J1253+7054 host galaxy are marginally unresolved (see Fig. 1), preventing us from performing a full modelling of the kinematics of our source; namely, we are not able to distinguish between ordered rotation or more complex kinematics (e.g. Neeleman et al. 2021). Therefore, we estimate Mdyn in a simplified way, following Decarli et al. (2018). Under the assumption of a dispersion-dominated system, we can express Mdyn with the equation
![Mathematical equation: $$ \begin{aligned} M_\mathrm{dyn} = \frac{3}{2} \frac{R_{{\text{[C}}{\small {{\text{ II]}}}}} \sigma _{{\text{[C}}{\small {{\text{ II]}}}}}^2}{G}, \end{aligned} $$](/articles/aa/full_html/2026/07/aa59319-26/aa59319-26-eq36.gif) (5)
(5)
where R[C II] is the size of the [C II]-emitting region, defined from a Gaussian fit of the visibilities (1.07 ± 0.15 kpc, see Sect. 3.3), σ[C II] is derived from the Gaussian fit of the line profile (94.5 km s−1) and G is the gravitational constant.
In the cases where the line width is dominated by rotation, the gas assumes a flat disk structure with inclination angle i (e.g. Willott et al. 2015). Under this assumption, the dynamic mass can be expressed as
![Mathematical equation: $$ \begin{aligned} M_\mathrm{dyn} = \frac{R_{{\text{[C}}{\small {{\text{ II]}}}}}}{G} \left( \frac{0.75\,\mathrm{FWHM} _{{\text{[C}}{\small {{\text{ II]}}}}}}{\sin (\textit{i})} \right)^{2}. \end{aligned} $$](/articles/aa/full_html/2026/07/aa59319-26/aa59319-26-eq38.gif) (6)
(6)
We adopted an inclination angle of i = 46°, which represents the median inclination of the z > 6 quasar hosts sample of Wang et al. (2024). By using both Eq. (5) and Eq. (6), we found the Mdyn value to be  M⊙ and
  M⊙, respectively. Previous studies (e.g. Decarli et al. 2018) have shown that Eq. (6) typically yields values that are three to four times higher than those obtained with Eq. (5). For a discussion of the uncertainties involved in deriving dynamical masses from unresolved data, we refer to de Blok & Walter (2014). The lower Mdyn estimate is one order of magnitude lower than the dynamical mass of the other z ∼ 7.5 quasars (e.g. Venemans et al. 2017a; Wang et al. 2024, and see Fig. 5).
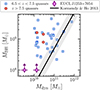 |
Fig. 5. MBH versus Mdyn of EUCL J1253+7054 compared to measurements from other high-z quasars (data from Wang et al. 2024). For our source, we plot two points at the two estimated Mdyn values (see Sect. 3.6) and at the lower limit of the black hole mass (assuming Eddington-limited accretion). The black line represents the local relation of Kormendy & Ho (2013). |
The limited angular resolution of our data prevents a precise determination of the [C II] extent and our R[C II] estimate should be interpreted with caution. We cannot exclude the presence of more extended [C II] emission, which would increase the derived dynamical mass, placing it closer to the bulk population of high-z quasars (Mdyn ≳ 1011, see Fig. 5). However, extended [C II] halos (on scales of ≈10 kpc), as observed in z = 5–7 star-forming galaxies (e.g. Fujimoto et al. 2019), have not been detected in z > 6 quasar hosts to date, even in high-resolution ALMA observations (e.g. Neeleman et al. 2021). Our estimates of Mdust, Mgas, and Mdyn are all reported in Table 1.
When combined with SMBH mass measurements, Mdyn provides insight into SMBH–galaxy co-evolution (assuming that the total mass traced by the dynamical mass is dominated by stars and gas). Several studies have revealed that SMBHs in the EoR appear to be overmassive relative to their local Universe counterparts (e.g. Venemans et al. 2016; Shao et al. 2017; Farina et al. 2022; Wang et al. 2024), with high-redshift quasars exhibiting higher MBH/Mdyn ratios than local galaxies. However, this apparent evolution is strongly influenced by observational selection biases, since high-redshift observations primarily target the most luminous quasars, which preferentially sample galaxies hosting exceptionally massive black holes (e.g. Volonteri & Reines 2016). Indeed, recent works (e.g. Izumi et al. 2021a; Bouwens et al. 2025) have shown that UV-faint quasars at z > 6 could be hosted by very massive galaxies while simultaneously harbouring lower mass black holes (< 109 M⊙), making the MBH/Mdyn ratio consistent with the Local Universe relation and a factor of ∼15 lower than the ratios observed in UV-bright quasars. Using detailed modelling, Silverman et al. (2025) and Li et al. (2025) suggest that when observational biases and measurement uncertainties are taken into account, the MBH/Mdyn ratios of high-redshift quasars actually follow the same black hole–galaxy mass relation as their local counterparts. This is consistent with the de-biased local relation of e.g. Shankar et al. (2016).
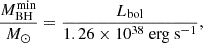
The optical/NIR data that we have in hand for EUCL J1253+7054 (see Yang et al. 2026) do not cover the C IV and Mg II broad emission lines that are commonly used to estimate MBH through the standard single epoch method (e.g. Farina et al. 2022; Belladitta et al. 2025). However, assuming that the quasar radiates below or at the Eddington limit, we can estimate a lower limit on the black hole mass,
 (7)
(7)
where Lbol is the bolometric luminosity of EUCL J1253+7054, with log10(Lbol/L⊙) = 46.10 reported in Yang et al. (2026), which was inferred from M1450 using the empirical conversion from Runnoe et al. (2012) and under the assumption of negligible obscuration. From this equation we obtain a value of MBHmin of 108 M⊙, consistent with black hole masses of UV-faint and bright z > 6 quasars (e.g. Willott et al. 2010; Onoue et al. 2019; Yang et al. 2021). The estimated MBH/Mdyn ratio is in the range 0.007–0.03, due to large uncertainties in both measurements. This range of values is similar to that of the UV-luminous high-z quasars reported in the literature (e.g. Wang et al. 2024, see Fig. 5). A dynamical mass > 1010 M⊙ and a black hole mass below a few 108 M⊙ would be needed to place EUCL J1253+7054 on the local scaling relation.
4. Concluding remarks
In this paper we report NOEMA observations of the z[C II] = 7.6980 ± 0.0004 quasar EUCL J1253+7054, revealing it to be the brightest [C II] emitter among the z > 7.5 quasars targeted to date (see Fig. 6), despite being nearly two magnitudes fainter in the rest-frame UV (M1450 = −24.06). This finding aligns with the recent findings by Bouwens et al. (2025), who showed that UV-faint quasars at z ∼ 6 are predominantly hosted by massive, [C II]-luminous star-forming galaxies. If quasars universally reside in massive galaxies, variations in their UV luminosity may primarily reflect dust obscuration (e.g. Kato et al. 2020; Izumi et al. 2021b) or extreme sub-Eddington accretion (e.g. Matsuoka et al. 2019), rather than differences in host galaxy mass. As a result, UV-faint quasars like EUCL J1253+7054 could represent a different evolutionary phase from UV-bright quasars, possibly marking a transition between overmassive black holes at early times and the local MBH/Mdyn relation.
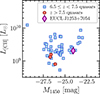 |
Fig. 6. L[C II] vs M1450 for EUCL J1253+7054 and for z ≥ 6.5 quasars reported in the literature (Wang et al. 2024; Bouwens et al. 2025; Decarli & Díaz-Santos 2025). Despite its lower UV brightness, EUCL J1253+7054 is the brightest [C II] emitter at z > 7.5, suggesting that the quasar UV luminosity is not a good proxy of the host-galaxy [C II] emission. |
Testing this scenario requires a larger sample of z > 7.5 quasars spanning a range of UV luminosities, with both host galaxy measurements (e.g. with ALMA/NOEMA) and black hole mass constraints (e.g. with JWST). The Euclid mission is poised to deliver such a sample in the coming years (Euclid Collaboration: Barnett et al. 2019; Bañados et al. 2025), fundamentally changing the landscape of black hole studies in the early Universe.
Acknowledgments
We thank the anonymous referee for their valuable suggestions, which improved the quality and clarity of this paper. The Euclid Consortium acknowledges the European Space Agency and a number of agencies and institutes that have supported the development of Euclid, in particular the Agenzia Spaziale Italiana, the Austrian Forschungsförderungsgesellschaft funded through BMIMI, the Belgian Science Policy, the Canadian Euclid Consortium, the Deutsches Zentrum für Luft- und Raumfahrt, the DTU Space and the Niels Bohr Institute in Denmark, the French Centre National d’Etudes Spatiales, the Fundação para a Ciência e a Tecnologia, the Hungarian Academy of Sciences, the Ministerio de Ciencia, Innovación y Universidades, the National Aeronautics and Space Administration, the National Astronomical Observatory of Japan, the Netherlandse Onderzoekschool Voor Astronomie, the Norwegian Space Agency, the Research Council of Finland, the Romanian Space Agency, the State Secretariat for Education, Research, and Innovation (SERI) at the Swiss Space Office (SSO), and the United Kingdom Space Agency. A complete and detailed list is available on the Euclid web site (www.euclid-ec.org/consortium/community/). This work is based on observations carried out under project number E24AH with the IRAM NOEMA Interferometer. IRAM is supported by INSU/CNRS (France), MPG (Germany) and IGN (Spain). R. Decarli acknowledges support from the INAF GO 2022 grant “The birth of the giants: JWST sheds light on the build-up of quasars at cosmic dawn”, INAF Minigrant 2024 “The interstellar medium at high redshift”, and by the PRIN MUR “2022935STW”, RFF M4.C2.1.1, CUP J53D23001570006 and C53D23000950006. D. Yang and J. F. Hennawi acknowledge support from the European Research Council (ERC) under the European Union’s Horizon 2020 research and innovation program (grant agreement No 885301). J. F. Hennawi acknowledges support from NSF grant No. 2307180. M.O. is supported by the Japan Society for the Promotion of Science (JSPS) KAKENHI Grant Number 24K22894. F. Guarneri and J.-T. Schindler are supported by the Deutsche Forschungsgemeinschaft (DFG, German Research Foundation) – Project number 518006966. S. E. I. Bosman is supported by the Deutsche Forschungsgemeinschaft (DFG) under Emmy Noether grant number BO 5771/1-1. F. Wang acknowledges support from NSF award AST-2513040. This work made use of NumPy (Harris et al. 2020), SciPy (Virtanen et al. 2020), Astropy (Astropy Collaboration 2013, 2018, 2022), InterferoPy (Boogaard et al. 2021), mapping and clic within GILDAS (Gildas Team 2013), CASA (McMullin et al. 2007).
References
- Astropy Collaboration (Robitaille, T. P., et al.) 2013, A&A, 558, A33 [NASA ADS] [CrossRef] [EDP Sciences] [Google Scholar]
- Astropy Collaboration (Price-Whelan, A. M., et al.) 2018, AJ, 156, 123 [Google Scholar]
- Astropy Collaboration (Price-Whelan, A. M., et al.) 2022, ApJ, 935, 167 [NASA ADS] [CrossRef] [Google Scholar]
- Bañados, E., Decarli, R., Walter, F., et al. 2015, ApJ, 805, L8 [CrossRef] [Google Scholar]
- Bañados, E., Venemans, B. P., Mazzucchelli, C., et al. 2018, Nature, 553, 473 [Google Scholar]
- Bañados, E., Novak, M., Neeleman, M., et al. 2019, ApJ, 881, L23 [CrossRef] [Google Scholar]
- Bañados, E., Khusanova, Y., Decarli, R., et al. 2024, ApJ, 977, L46 [Google Scholar]
- Bañados, E., Le Brun, V., Belladitta, S., et al. 2025, MNRAS, 542, 1088 [Google Scholar]
- Barnett, R., Warren, S. J., Banerji, M., et al. 2015, A&A, 575, A31 [NASA ADS] [CrossRef] [EDP Sciences] [Google Scholar]
- Beelen, A., Cox, P., Benford, D. J., et al. 2006, ApJ, 642, 694 [NASA ADS] [CrossRef] [Google Scholar]
- Belladitta, S., Bañados, E., Xie, Z.-L., et al. 2025, A&A, 699, A335 [NASA ADS] [CrossRef] [EDP Sciences] [Google Scholar]
- Boogaard, L., Meyer, R. A., & Novak, M. 2021, https://doi.org/10.5281/ZENODO.5775603 [Google Scholar]
- Bosman, S. E. I., Álvarez-Márquez, J., Davies, F. B., et al. 2025, arXiv e-prints [arXiv:2511.02902] [Google Scholar]
- Bouwens, R. J., Smit, R., Schouws, S., et al. 2022, ApJ, 931, 160 [NASA ADS] [CrossRef] [Google Scholar]
- Bouwens, R. J., Banados, E., Decarli, R., et al. 2025, arXiv e-prints [arXiv:2506.24128] [Google Scholar]
- Carilli, C. L., & Walter, F. 2013, ARA&A, 51, 105 [NASA ADS] [CrossRef] [Google Scholar]
- Casey, C. M., Narayanan, D., & Cooray, A. 2014, Phys. Rep., 541, 45 [Google Scholar]
- Costa, M., Decarli, R., Pozzi, F., et al. 2026, A&A, 706, A285 [NASA ADS] [CrossRef] [EDP Sciences] [Google Scholar]
- da Cunha, E., Groves, B., Walter, F., et al. 2013, ApJ, 766, 13 [Google Scholar]
- de Blok, W. J. G., & Walter, F. 2014, AJ, 147, 96 [NASA ADS] [CrossRef] [Google Scholar]
- De Looze, I., Cormier, D., Lebouteiller, V., et al. 2014, A&A, 568, A62 [NASA ADS] [CrossRef] [EDP Sciences] [Google Scholar]
- Decarli, R., & Díaz-Santos, T. 2025, A&ARv, 33, 4 [Google Scholar]
- Decarli, R., Walter, F., Venemans, B. P., et al. 2017, Nature, 545, 457 [Google Scholar]
- Decarli, R., Walter, F., Venemans, B. P., et al. 2018, ApJ, 854, 97 [Google Scholar]
- Decarli, R., Pensabene, A., Venemans, B., et al. 2022, A&A, 662, A60 [NASA ADS] [CrossRef] [EDP Sciences] [Google Scholar]
- Decarli, R., Pensabene, A., Diaz-Santos, T., et al. 2023, A&A, 673, A157 [NASA ADS] [CrossRef] [EDP Sciences] [Google Scholar]
- Di Matteo, T., Springel, V., & Hernquist, L. 2005, Nature, 433, 604 [NASA ADS] [CrossRef] [Google Scholar]
- Díaz-Santos, T., Armus, L., Charmandaris, V., et al. 2013, ApJ, 774, 68 [Google Scholar]
- Díaz-Santos, T., Assef, R. J., Blain, A. W., et al. 2016, ApJ, 816, L6 [Google Scholar]
- Díaz-Santos, T., Armus, L., Charmandaris, V., et al. 2017, ApJ, 846, 32 [Google Scholar]
- Ding, X., Onoue, M., Silverman, J. D., et al. 2025, ApJ, 993, 91 [Google Scholar]
- Dunne, L., Eales, S., Edmunds, M., et al. 2000, MNRAS, 315, 115 [Google Scholar]
- Euclid Collaboration (Barnett, R., et al.) 2019, A&A, 631, A85 [NASA ADS] [CrossRef] [EDP Sciences] [Google Scholar]
- Euclid Collaboration (Jahnke, K., et al.) 2025, A&A, 697, A3 [Google Scholar]
- Euclid Collaboration (Mellier, Y., et al.) 2025, A&A, 697, A1 [Google Scholar]
- Fan, X., Bañados, E., & Simcoe, R. A. 2023, ARA&A, 61, 373 [NASA ADS] [CrossRef] [Google Scholar]
- Farina, E. P., Schindler, J.-T., Walter, F., et al. 2022, ApJ, 941, 106 [NASA ADS] [CrossRef] [Google Scholar]
- Farrah, D., Lebouteiller, V., Spoon, H. W. W., et al. 2013, ApJ, 776, 38 [Google Scholar]
- Feruglio, C., Maio, U., Tripodi, R., et al. 2023, ApJ, 954, L10 [NASA ADS] [CrossRef] [Google Scholar]
- Fujimoto, S., Ouchi, M., Ferrara, A., et al. 2019, ApJ, 887, 107 [Google Scholar]
- Gildas Team 2013, GILDAS: Grenoble Image and Line Data Analysis Software, Astrophysics Source Code Library [record ascl:1305.010] [Google Scholar]
- Graciá-Carpio, J., Sturm, E., Hailey-Dunsheath, S., et al. 2011, ApJ, 728, L7 [Google Scholar]
- Harikane, Y., Zhang, Y., Nakajima, K., et al. 2023, ApJ, 959, 39 [NASA ADS] [CrossRef] [Google Scholar]
- Harris, C. R., Millman, K. J., van der Walt, S. J., et al. 2020, Nature, 585, 357 [NASA ADS] [CrossRef] [Google Scholar]
- Helou, G., Khan, I. R., Malek, L., & Boehmer, L. 1988, ApJS, 68, 151 [NASA ADS] [CrossRef] [Google Scholar]
- Herrera-Camus, R., Bolatto, A. D., Wolfire, M. G., et al. 2015, ApJ, 800, 1 [Google Scholar]
- Herrera-Camus, R., Sturm, E., Graciá-Carpio, J., et al. 2018, ApJ, 861, 94 [Google Scholar]
- Hodge, J. A., & da Cunha, E. 2020, Roy. Soc. Open Sci., 7, 200556 [NASA ADS] [CrossRef] [Google Scholar]
- Hopkins, P. F., Hernquist, L., Cox, T. J., & Kereš, D. 2008, ApJS, 175, 356 [Google Scholar]
- Inayoshi, K., Visbal, E., & Haiman, Z. 2020, ARA&A, 58, 27 [NASA ADS] [CrossRef] [Google Scholar]
- Izumi, T., Matsuoka, Y., Fujimoto, S., et al. 2021a, ApJ, 914, 36 [CrossRef] [Google Scholar]
- Izumi, T., Onoue, M., Matsuoka, Y., et al. 2021b, ApJ, 908, 235 [NASA ADS] [CrossRef] [Google Scholar]
- Izumi, T., Matsuoka, Y., Onoue, M., et al. 2024, ApJ, 972, 116 [NASA ADS] [CrossRef] [Google Scholar]
- Kaasinen, M., Venemans, B., Harrington, K. C., et al. 2024, A&A, 684, A33 [NASA ADS] [CrossRef] [EDP Sciences] [Google Scholar]
- Kato, N., Matsuoka, Y., Onoue, M., et al. 2020, PASJ, 72, 84 [NASA ADS] [CrossRef] [Google Scholar]
- Kennicutt, R. C., & Evans, N. J. 2012, ARA&A, 50, 531 [NASA ADS] [CrossRef] [Google Scholar]
- Khusanova, Y., Bañados, E., Mazzucchelli, C., et al. 2022, A&A, 664, A39 [NASA ADS] [CrossRef] [EDP Sciences] [Google Scholar]
- Kormendy, J., & Ho, L. C. 2013, ARA&A, 51, 511 [Google Scholar]
- Langer, W. D., & Pineda, J. L. 2015, A&A, 580, A5 [NASA ADS] [CrossRef] [EDP Sciences] [Google Scholar]
- Leipski, C., Meisenheimer, K., Walter, F., et al. 2013, ApJ, 772, 103 [NASA ADS] [CrossRef] [Google Scholar]
- Leipski, C., Meisenheimer, K., Walter, F., et al. 2014, ApJ, 785, 154 [Google Scholar]
- Li, J., Venemans, B. P., Walter, F., et al. 2022, ApJ, 930, 27 [NASA ADS] [CrossRef] [Google Scholar]
- Li, J., Silverman, J. D., Shen, Y., et al. 2025, ApJ, 981, 19 [Google Scholar]
- Magdis, G. E., Rigopoulou, D., Hopwood, R., et al. 2014, ApJ, 796, 63 [Google Scholar]
- Maiolino, R., Scholtz, J., Curtis-Lake, E., et al. 2024, A&A, 691, A145 [NASA ADS] [CrossRef] [EDP Sciences] [Google Scholar]
- Matsuoka, Y., Onoue, M., Kashikawa, N., et al. 2019, ApJ, 872, L2 [Google Scholar]
- Matsuoka, Y., Onoue, M., Iwasawa, K., et al. 2023, ApJ, 949, L42 [NASA ADS] [CrossRef] [Google Scholar]
- Matsuoka, Y., Iwasawa, K., Onoue, M., et al. 2025, ApJS, 280, 68 [Google Scholar]
- Mazzucchelli, C., Bischetti, M., D’Odorico, V., et al. 2023, A&A, 676, A71 [NASA ADS] [CrossRef] [EDP Sciences] [Google Scholar]
- Mazzucchelli, C., Decarli, R., Belladitta, S., et al. 2025, A&A, 694, A171 [NASA ADS] [CrossRef] [EDP Sciences] [Google Scholar]
- McMullin, J. P., Waters, B., Schiebel, D., Young, W., & Golap, K. 2007, in Astronomical Data Analysis Software and Systems XVI, eds. R. A. Shaw, F. Hill, & D. J. Bell, ASP Conf. Ser., 376, 127 [Google Scholar]
- Neeleman, M., Bañados, E., Walter, F., et al. 2019, ApJ, 882, 10 [Google Scholar]
- Neeleman, M., Novak, M., Venemans, B. P., et al. 2021, ApJ, 911, 141 [NASA ADS] [CrossRef] [Google Scholar]
- Novak, M., Bañados, E., Decarli, R., et al. 2019, ApJ, 881, 63 [NASA ADS] [CrossRef] [Google Scholar]
- Onoue, M., Kashikawa, N., Matsuoka, Y., et al. 2019, ApJ, 880, 77 [Google Scholar]
- Roberts-Borsani, G., Treu, T., Shapley, A., et al. 2024, ApJ, 976, 193 [NASA ADS] [CrossRef] [Google Scholar]
- Roberts-Borsani, G., Bagley, M., Rojas-Ruiz, S., et al. 2025, ApJ, 983, 18 [Google Scholar]
- Rojas-Ruiz, S., Bañados, E., Neeleman, M., et al. 2021, ApJ, 920, 150 [NASA ADS] [CrossRef] [Google Scholar]
- Runnoe, J. C., Brotherton, M. S., & Shang, Z. 2012, MNRAS, 422, 478 [Google Scholar]
- Rybak, M., Calistro Rivera, G., Hodge, J. A., et al. 2019, ApJ, 876, 112 [Google Scholar]
- Salvestrini, F., Feruglio, C., Tripodi, R., et al. 2025, A&A, 695, A23 [NASA ADS] [CrossRef] [EDP Sciences] [Google Scholar]
- Sanders, D. B., Mazzarella, J. M., Kim, D. C., Surace, J. A., & Soifer, B. T. 2003, AJ, 126, 1607 [Google Scholar]
- Schindler, J.-T., Hennawi, J. F., Davies, F. B., et al. 2025, Nat. Astron., 9, 1732 [Google Scholar]
- Schneider, R., Bianchi, S., Valiante, R., Risaliti, G., & Salvadori, S. 2015, A&A, 579, A60 [NASA ADS] [CrossRef] [EDP Sciences] [Google Scholar]
- Shankar, F., Bernardi, M., Sheth, R. K., et al. 2016, MNRAS, 460, 3119 [NASA ADS] [CrossRef] [Google Scholar]
- Shao, Y., Wang, R., Jones, G. C., et al. 2017, ApJ, 845, 138 [NASA ADS] [CrossRef] [Google Scholar]
- Silverman, J., Li, J., Ding, X., et al. 2025, ApJ, 995, L67 [Google Scholar]
- Tripodi, R., Feruglio, C., Kemper, F., et al. 2023, ApJ, 946, L45 [NASA ADS] [CrossRef] [Google Scholar]
- Tripodi, R., Feruglio, C., Fiore, F., et al. 2024, A&A, 689, A220 [NASA ADS] [CrossRef] [EDP Sciences] [Google Scholar]
- Venemans, B. P., Walter, F., Zschaechner, L., et al. 2016, ApJ, 816, 37 [Google Scholar]
- Venemans, B. P., Walter, F., Decarli, R., et al. 2017a, ApJ, 851, L8 [NASA ADS] [CrossRef] [Google Scholar]
- Venemans, B. P., Walter, F., Decarli, R., et al. 2017b, ApJ, 845, 154 [Google Scholar]
- Venemans, B. P., Decarli, R., Walter, F., et al. 2018, ApJ, 866, 159 [Google Scholar]
- Venemans, B. P., Walter, F., Neeleman, M., et al. 2020, ApJ, 904, 130 [Google Scholar]
- Virtanen, P., Gommers, R., Oliphant, T. E., et al. 2020, Nat. Methods, 17, 261 [Google Scholar]
- Volonteri, M., & Reines, A. E. 2016, ApJ, 820, L6 [NASA ADS] [CrossRef] [Google Scholar]
- Wang, F., Yang, J., Fan, X., et al. 2021, ApJ, 907, L1 [Google Scholar]
- Wang, F., Yang, J., Fan, X., et al. 2024, ApJ, 968, 9 [NASA ADS] [CrossRef] [Google Scholar]
- Willott, C. J., Albert, L., Arzoumanian, D., et al. 2010, AJ, 140, 546 [NASA ADS] [CrossRef] [Google Scholar]
- Willott, C. J., Bergeron, J., & Omont, A. 2015, ApJ, 801, 123 [NASA ADS] [CrossRef] [Google Scholar]
- Witstok, J., Jones, G. C., Maiolino, R., Smit, R., & Schneider, R. 2023, MNRAS, 523, 3119 [NASA ADS] [CrossRef] [Google Scholar]
- Yang, J., Wang, F., Fan, X., et al. 2020, ApJ, 897, L14 [Google Scholar]
- Yang, J., Wang, F., Fan, X., et al. 2021, ApJ, 923, 262 [NASA ADS] [CrossRef] [Google Scholar]
- Yang, D., Hennawi, J. F., Guarneri, F., Wolf, J., & Belladitta, S. 2026, A&A, 711, A104 [NASA ADS] [CrossRef] [EDP Sciences] [Google Scholar]
- Yue, M., Yang, J., Fan, X., et al. 2021, ApJ, 917, 99 [NASA ADS] [CrossRef] [Google Scholar]
All Tables
All Figures
|
Fig. 1. 0 |
| In the text | |
|
Fig. 2. NOEMA spectrum of the [C II] emission line in EUCL J1253+7054 (observed frame) obtained from the 30 km s−1 data cube. The red solid curve is the fit to the data consisting of a single Gaussian component plus continuum. A few channels close to the border of the sub-bands, near 218.25 GHz have been masked (vertical grey lines). The bottom panel displays the residuals (data − model), with the dashed line marking the zero level. |
| In the text | |
|
Fig. 3. 30 km s−1 [C II] channel maps of the continuum-subtracted data of EUCL J1253+7054. Each channel is labelled with its central velocity. The central black cross indicates the NIR position (same as Fig. 1). Contours are plotted starting from 3σ, with steps of 1σ, where σ is the noise in each individual channel. The synthesised beam is shown in the lower left corner of each panel. North is up, east is left. |
| In the text | |
|
Fig. 4. [C II]-to-IR luminosity ratio as a function of IR luminosity for EUCL J1253+7054, compared with measurements from the literature: high-redshift quasars are from Wang et al. (2024) and Bouwens et al. (2025), while the compilation of galaxies is from Decarli & Díaz-Santos (2025) and include ULRIGs, Submillimeter galaxies, optically selected galaxies (primarily Lyman-break galaxies and Ly−α emitters) starbursts, main-sequence galaxies (see Decarli & Díaz-Santos 2025, for all the details). |
| In the text | |
|
Fig. 5. MBH versus Mdyn of EUCL J1253+7054 compared to measurements from other high-z quasars (data from Wang et al. 2024). For our source, we plot two points at the two estimated Mdyn values (see Sect. 3.6) and at the lower limit of the black hole mass (assuming Eddington-limited accretion). The black line represents the local relation of Kormendy & Ho (2013). |
| In the text | |
|
Fig. 6. L[C II] vs M1450 for EUCL J1253+7054 and for z ≥ 6.5 quasars reported in the literature (Wang et al. 2024; Bouwens et al. 2025; Decarli & Díaz-Santos 2025). Despite its lower UV brightness, EUCL J1253+7054 is the brightest [C II] emitter at z > 7.5, suggesting that the quasar UV luminosity is not a good proxy of the host-galaxy [C II] emission. |
| In the text | |
Current usage metrics show cumulative count of Article Views (full-text article views including HTML views, PDF and ePub downloads, according to the available data) and Abstracts Views on Vision4Press platform.
Data correspond to usage on the plateform after 2015. The current usage metrics is available 48-96 hours after online publication and is updated daily on week days.
Initial download of the metrics may take a while.