


Fig. A.3.
Download original image
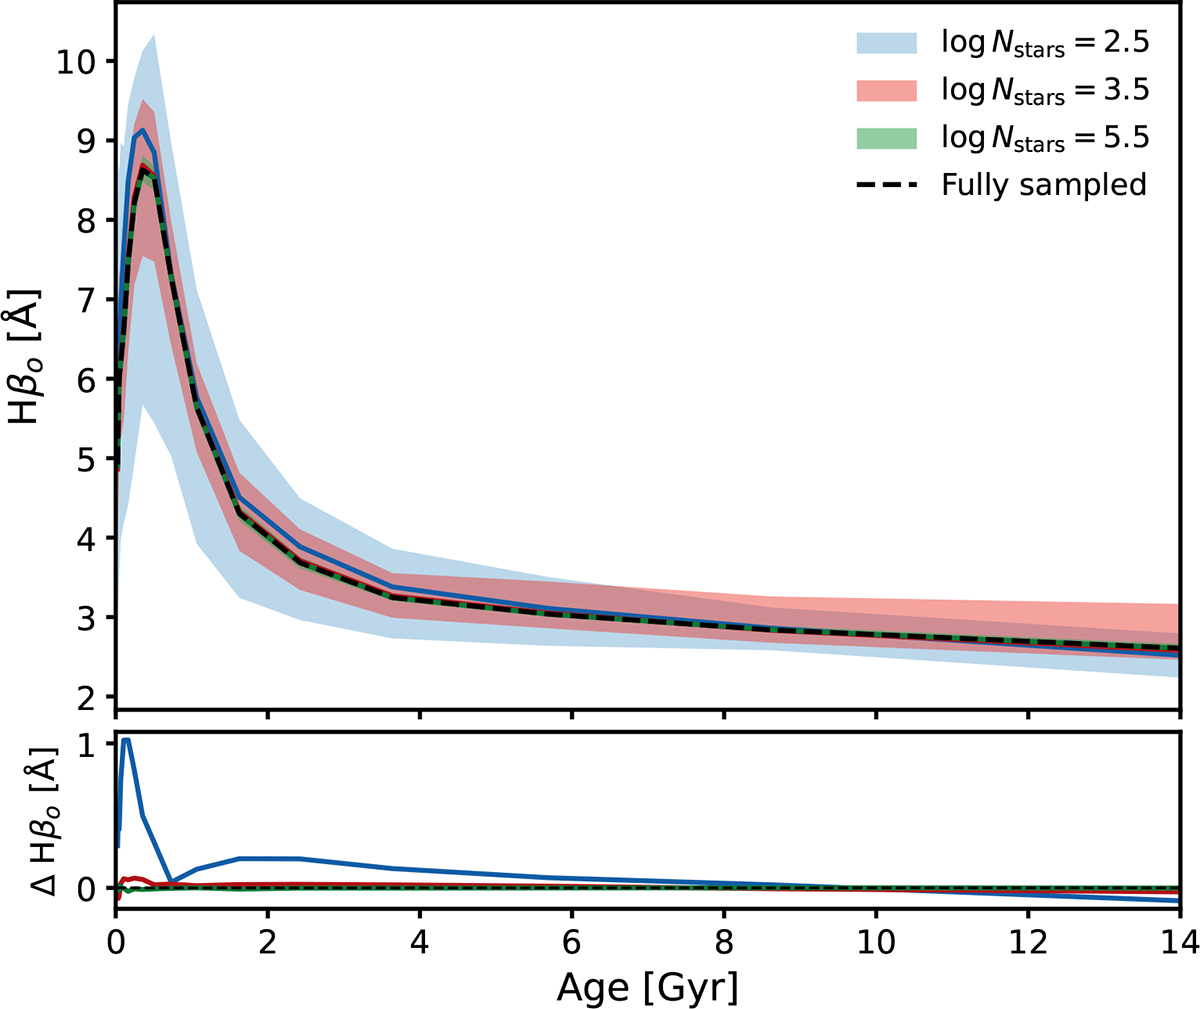
Age dependence of HβO. The top panel shows the distribution FASTAR HβO predictions as a function of age, for three different log Nstars values: 2.5 in blue, 3.5 in red and 5.5 in green. The shaded areas correspond to the 1/99 percentiles and the solid colored lines to the median trend. For reference, the predicted trend for a fully sampled population is shown with a dashed black line. The bottom panel shows the residuals between this dashed black lines and each of the median trends.
Current usage metrics show cumulative count of Article Views (full-text article views including HTML views, PDF and ePub downloads, according to the available data) and Abstracts Views on Vision4Press platform.
Data correspond to usage on the plateform after 2015. The current usage metrics is available 48-96 hours after online publication and is updated daily on week days.
Initial download of the metrics may take a while.