


Fig. 7.
Download original image
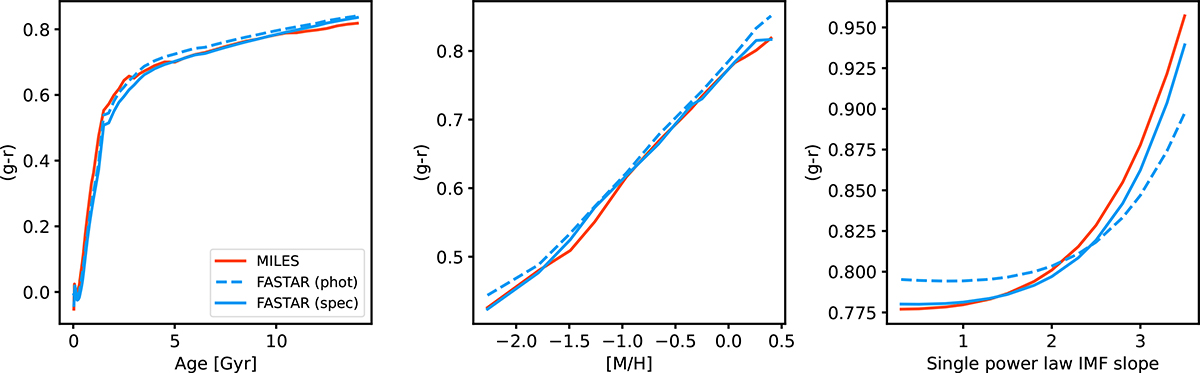
Color predictions. From left to right, each panel shows the color sensitivity of the photometric and spectroscopic FASTAR models (dashed and solid blue lines, respectively), as well as the MILES predictions (in orange) for comparison. The differences between the three models are due to the use of theoretical versus empirical stellar libraries and the choice of bolometric corrections (between FASTAR and MILES). The assumed ages, metallicities and IMF slopes are the same as in Fig. 6.
Current usage metrics show cumulative count of Article Views (full-text article views including HTML views, PDF and ePub downloads, according to the available data) and Abstracts Views on Vision4Press platform.
Data correspond to usage on the plateform after 2015. The current usage metrics is available 48-96 hours after online publication and is updated daily on week days.
Initial download of the metrics may take a while.