


Fig. 3.
Download original image
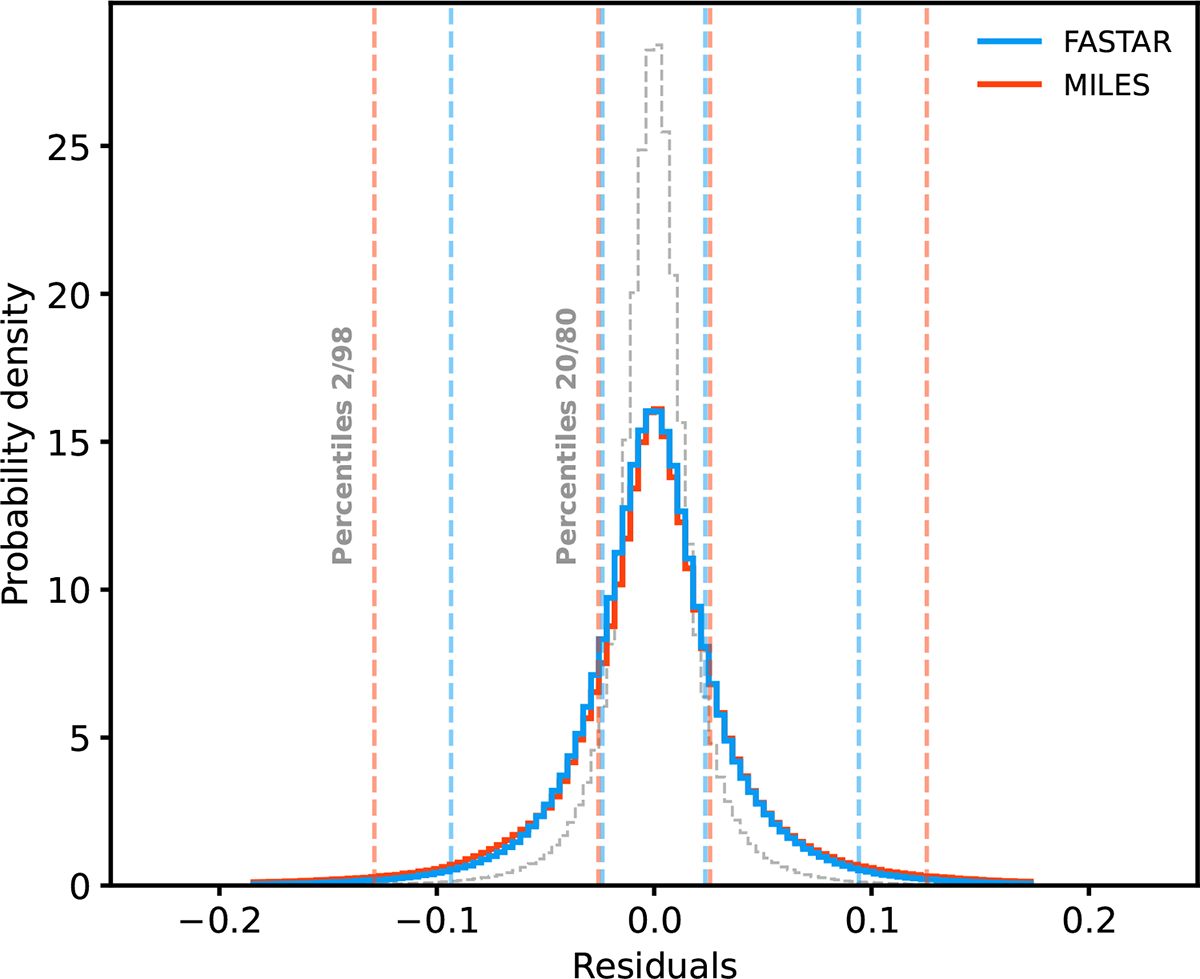
Comparison of residuals. Blue and orange lines represent the distribution of residuals for the FASTAR and MILES interpolators when predicting the stellar spectra of the MILES library. The behavior of both interpolation schemes is similar, as shown by the vertical dashed lines marking the 20th and 80th percentiles. However, the 2nd and 98th percentile vertical lines indicate that extreme errors are less common in FASTAR. For comparison, the gray histogram shows the error associated to the PCA compression.
Current usage metrics show cumulative count of Article Views (full-text article views including HTML views, PDF and ePub downloads, according to the available data) and Abstracts Views on Vision4Press platform.
Data correspond to usage on the plateform after 2015. The current usage metrics is available 48-96 hours after online publication and is updated daily on week days.
Initial download of the metrics may take a while.