


Fig. C.1.
Download original image
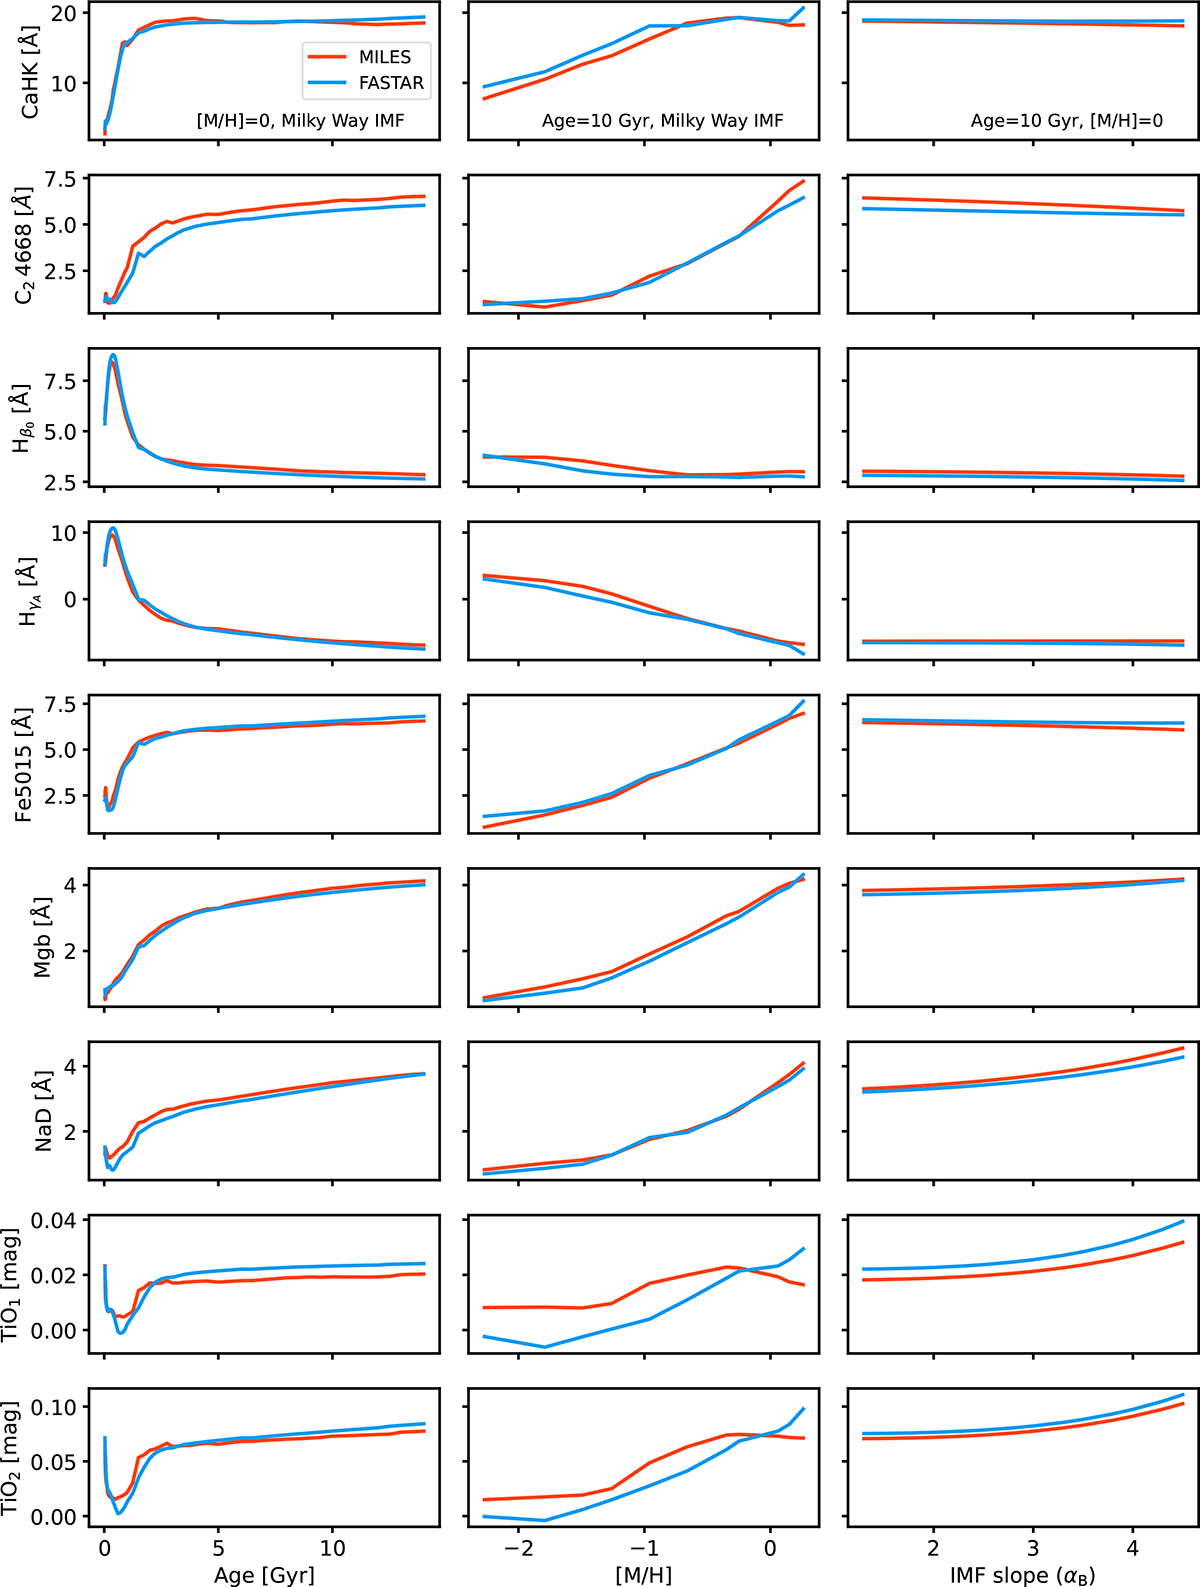
FASTAR versus MILES SSP predictions. Each row shows the dependence of a specific line-strength index with age (left), metallicity (middle) and IMF slope (right, under a bimodal parameterization) for FASTAR (in blue) and MILES (orange) SSP models. In each column, the value of the assumed age, metallicity and IMF slope is indicated in the first row (corresponding to the CaHK feature). Equivalent widths are calculated at the 2.51 Å nominal resolution of both sets of models.
Current usage metrics show cumulative count of Article Views (full-text article views including HTML views, PDF and ePub downloads, according to the available data) and Abstracts Views on Vision4Press platform.
Data correspond to usage on the plateform after 2015. The current usage metrics is available 48-96 hours after online publication and is updated daily on week days.
Initial download of the metrics may take a while.