


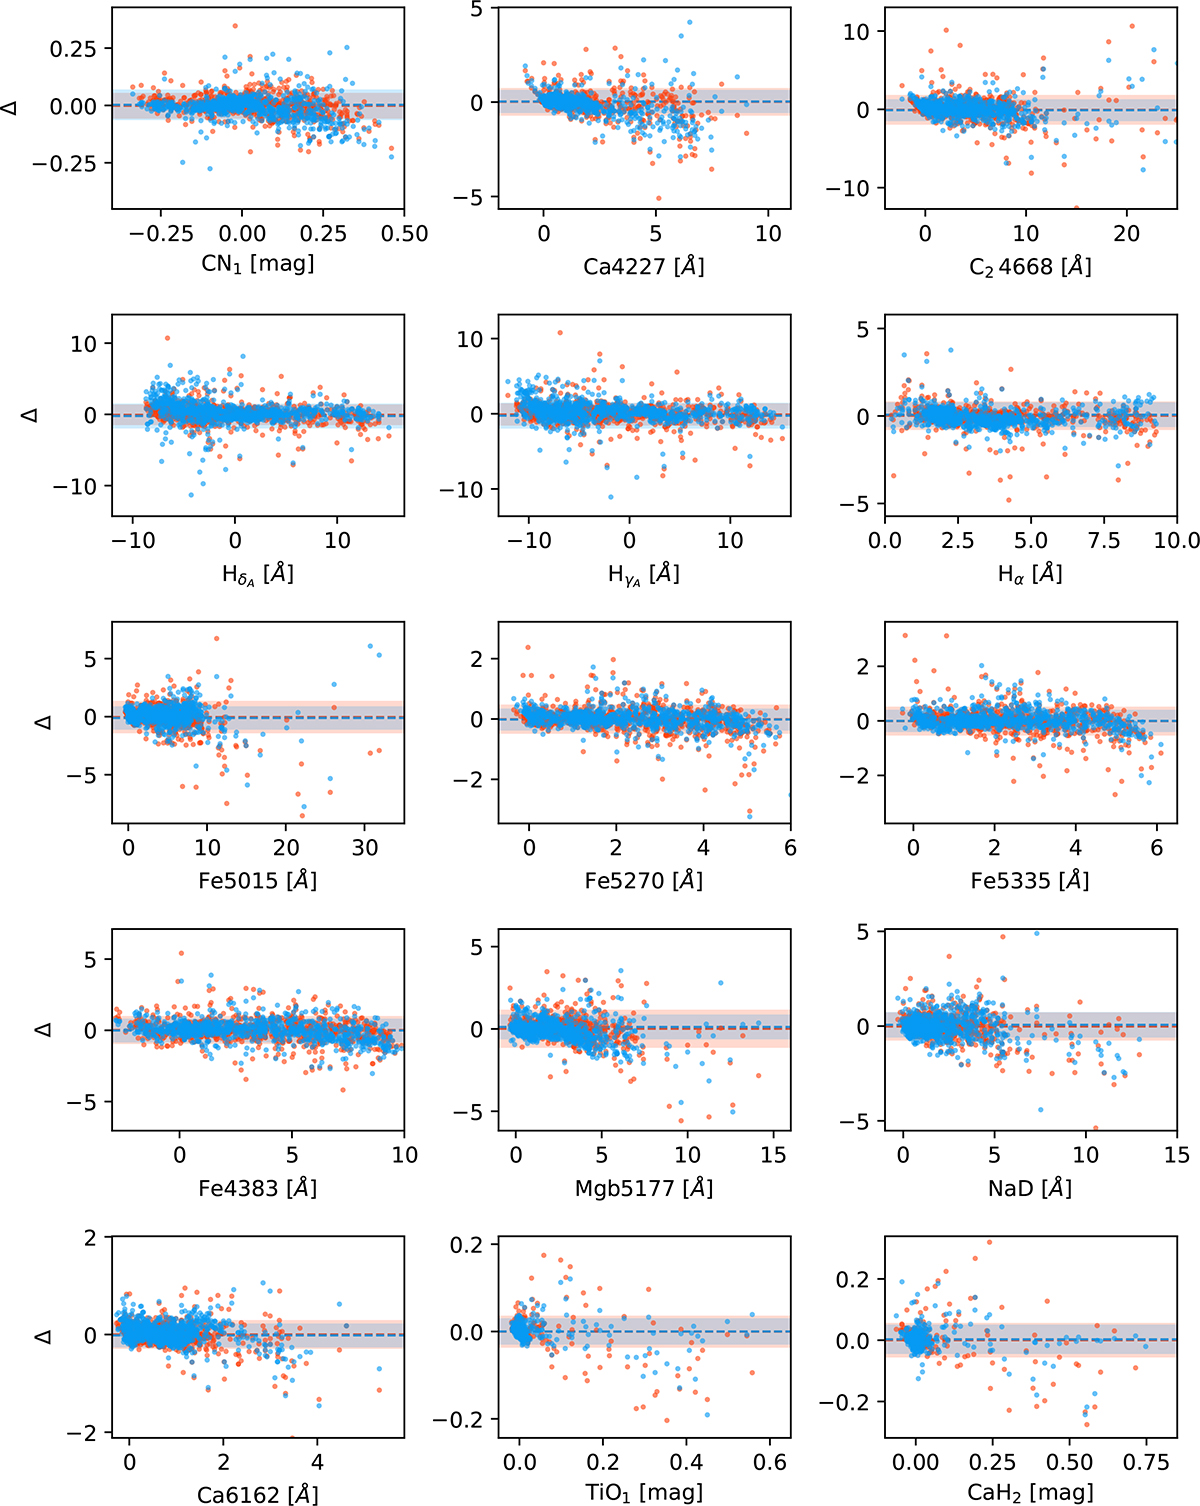
Fig. A.1.
Download original image
Residuals across the MILES stellar library. Blue symbols correspond to the difference between the FASTAR line-strengths predictions and the actual measurements over the MILES empirical spectra. For comparison, orange symbols indicate the predictions from the MILES interpolator. Dashed lines correspond to the mean of the distribution and shaded areas to the 1σ scatter.
Current usage metrics show cumulative count of Article Views (full-text article views including HTML views, PDF and ePub downloads, according to the available data) and Abstracts Views on Vision4Press platform.
Data correspond to usage on the plateform after 2015. The current usage metrics is available 48-96 hours after online publication and is updated daily on week days.
Initial download of the metrics may take a while.