


Fig. 6.
Download original image
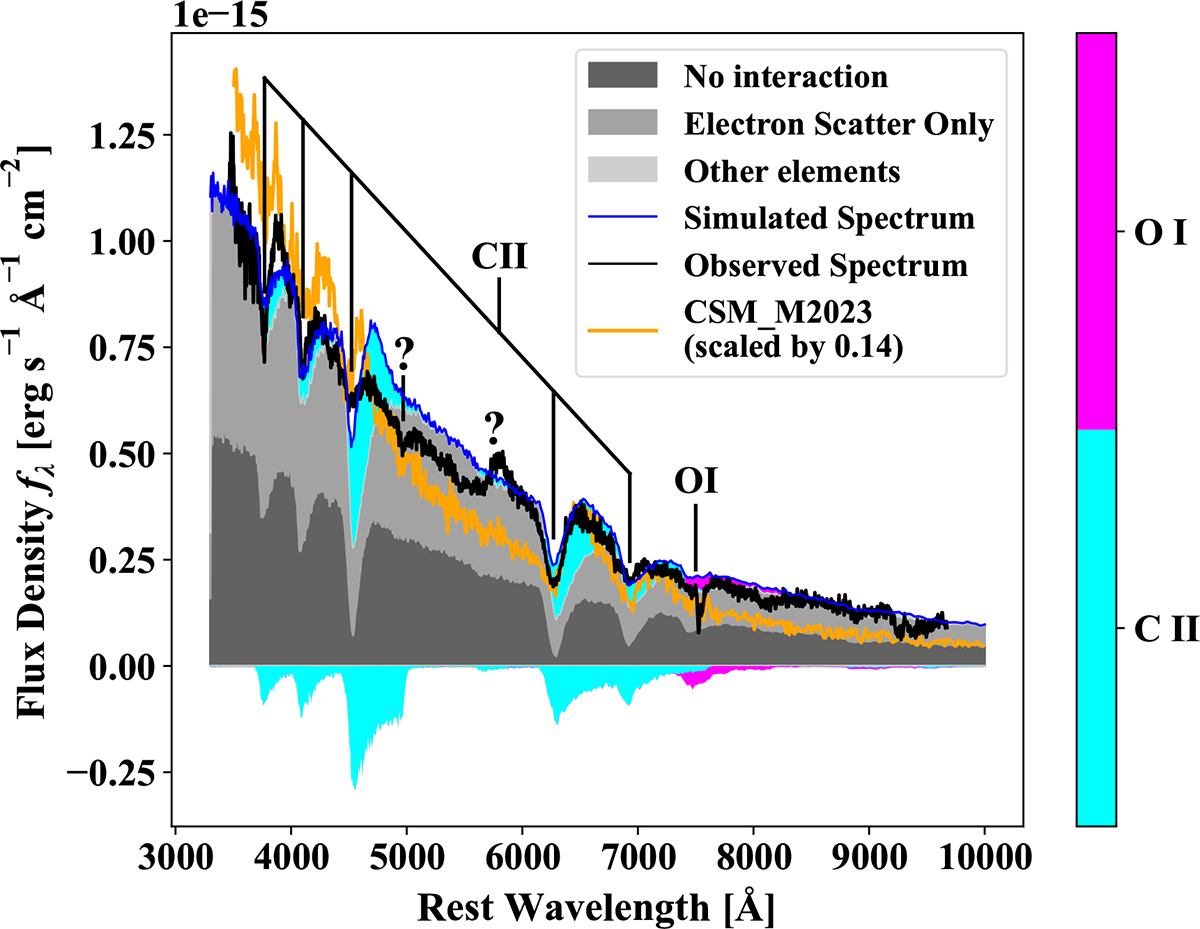
Comparison of the spectrum of SN 2024igg (solid black) at −13.9 days relative to B-band maximum, the synthetic spectrum using TARDIS (dashed blue), and a spectrum taken from the carbon-rich CSM interaction model (solid orange, labeled CSM_M2023) (Maeda et al. 2023). The spectrum of SN 2024igg has been calibrated by the photometry and corrected for reddening and host redshift. The flux density of the spectrum of CSM_M2023, with a CSM mass of 0.1 M⊙, is multiplied by a factor of 0.14 to match the emission peak at ∼6500 Å for visual comparison. The decomposition of the TARDIS spectrum is also shown in the plot, with the positive emission and negative absorption components labeled as different colors. The absorption features of C II and O I are denoted by vertical lines.
Current usage metrics show cumulative count of Article Views (full-text article views including HTML views, PDF and ePub downloads, according to the available data) and Abstracts Views on Vision4Press platform.
Data correspond to usage on the plateform after 2015. The current usage metrics is available 48-96 hours after online publication and is updated daily on week days.
Initial download of the metrics may take a while.