


Fig. 5.
Download original image
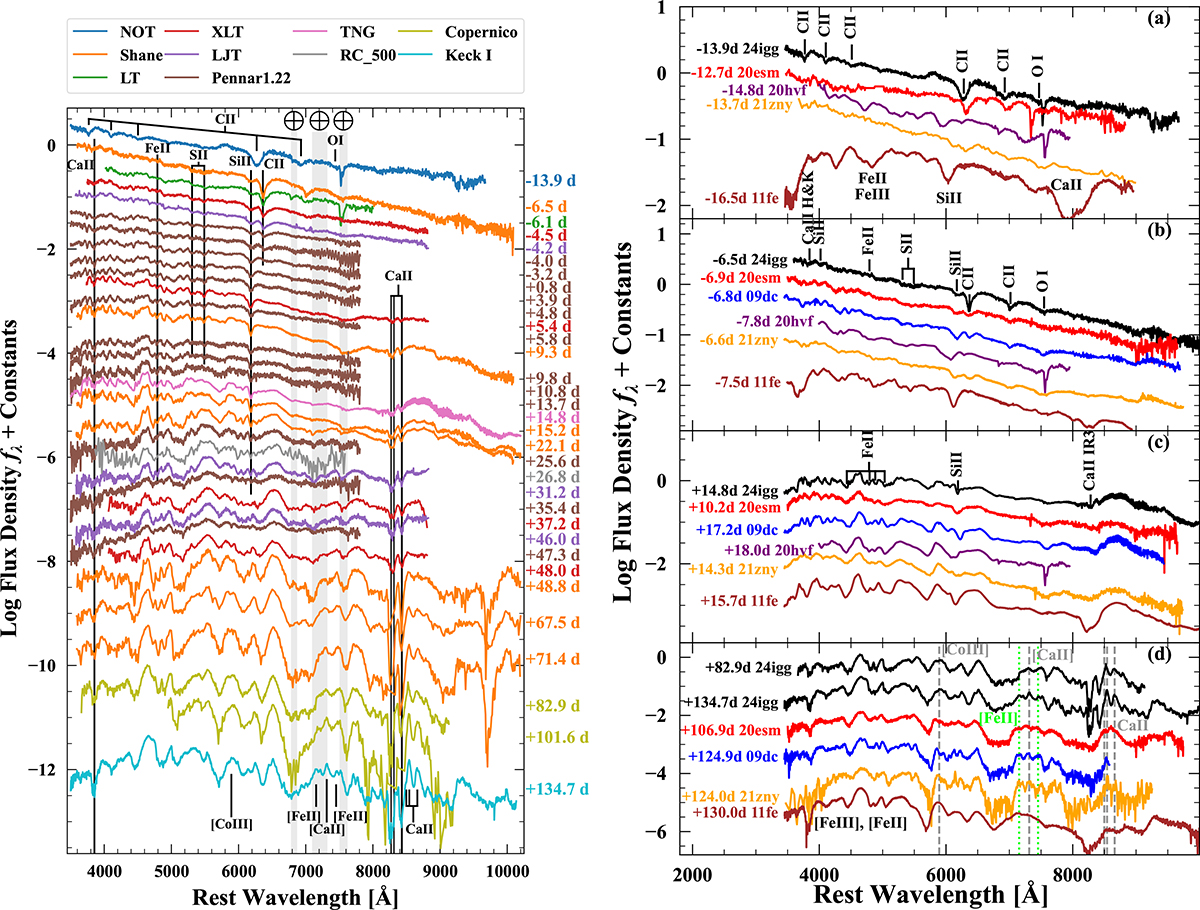
Optical spectral evolution of SN 2024igg and comparison with other SNe Ia. All spectra have been corrected for reddening and host-galaxy redshift. Left: Spectral evolution of SN 2024igg from −13.9 to +134.7 days relative to the B-band maximum. Spectra taken with different telescopes are plotted in different colors as indicated in the top legend, and the phase of each spectrum is shown on the right side. Regions of the main telluric absorption are marked by vertical gray bands. The long solid lines indicate Ca II H&K, Fe IIλ4924, S IIλλ5454, 5640, Si IIλ6355, and Ca IIλλλ8498, 8542, 8662 at −8000 km s−1, while C IIλ6580 is indicated at −10 000 km s−1. Right: Spectral comparison of SN 2024igg and SNe 2009dc, 2011fe, 2020esm, 2020hvf, and 2021zny at selected epochs (t ≈ −15, −7, +15, and +100 days). Spectral features are labeled with short lines in panels (a), (b), and (c). In panel (d), the rest wavelengths of [Co III] λ5893, [Ca II] λ7313, and Ca IIλλλ8498, 8542, 8662 are indicated with dashed gray lines, and those of [Fe II] λλ7155, 7453 are indicated with dotted lime green lines.
Current usage metrics show cumulative count of Article Views (full-text article views including HTML views, PDF and ePub downloads, according to the available data) and Abstracts Views on Vision4Press platform.
Data correspond to usage on the plateform after 2015. The current usage metrics is available 48-96 hours after online publication and is updated daily on week days.
Initial download of the metrics may take a while.