


Fig. 4.
Download original image
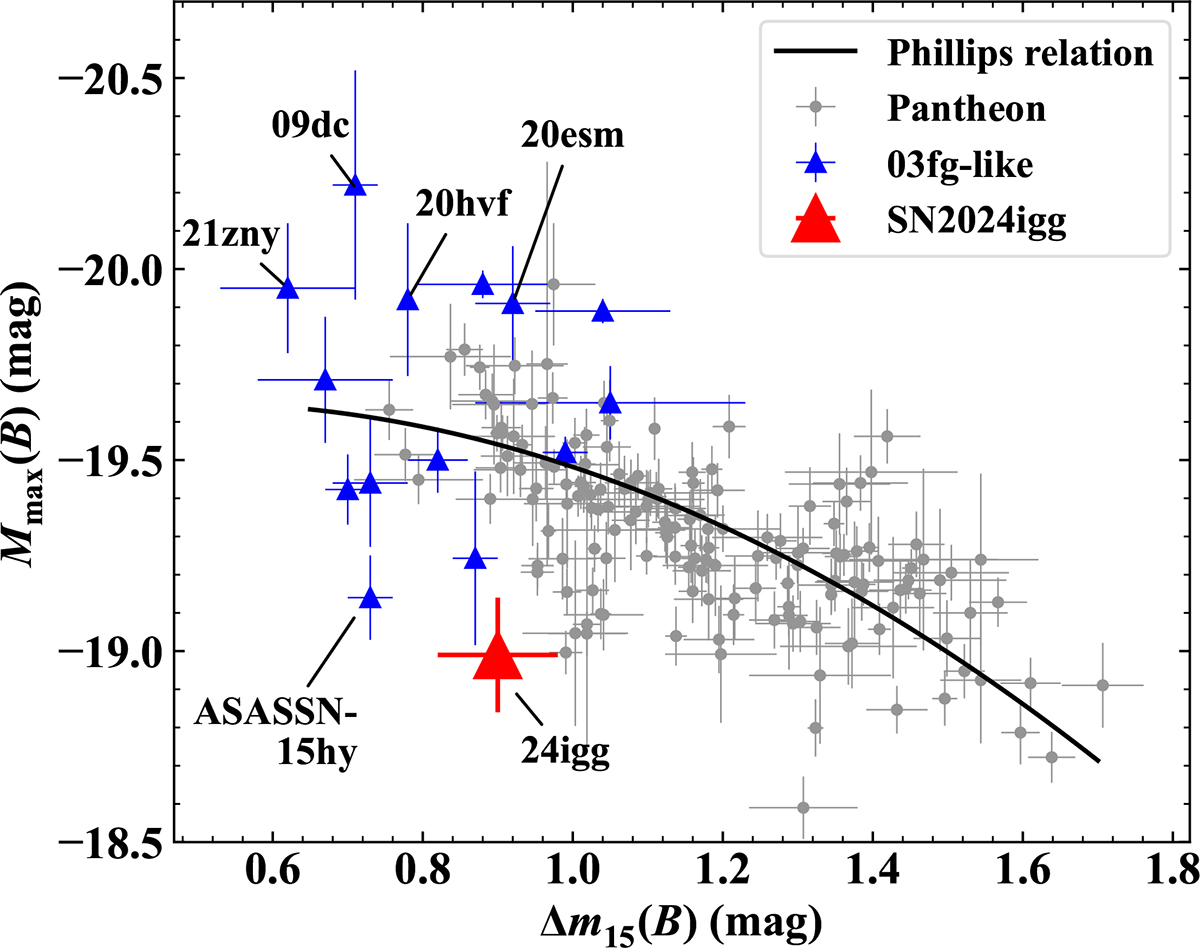
Comparison of the B-band light-curve decline rate and the absolute maximum magnitude for a sample of SNe Ia. SN 2024igg is emphasized as a red triangle. Normal SNe Ia from the Pantheon samples (Scolnic et al. 2018) are shown as gray dots. The solid black curve represents the best-fit Lira-Phillips relation. The 03fg-like sample, shown as blue triangles, is taken from Ashall et al. (2021) except for SNe 2009dc (Taubenberger et al. 2011), 2020esm (Dimitriadis et al. 2022), 2020hvf (Jiang et al. 2021), and 2021zny (Dimitriadis et al. 2023).
Current usage metrics show cumulative count of Article Views (full-text article views including HTML views, PDF and ePub downloads, according to the available data) and Abstracts Views on Vision4Press platform.
Data correspond to usage on the plateform after 2015. The current usage metrics is available 48-96 hours after online publication and is updated daily on week days.
Initial download of the metrics may take a while.