


Fig. 2.
Download original image
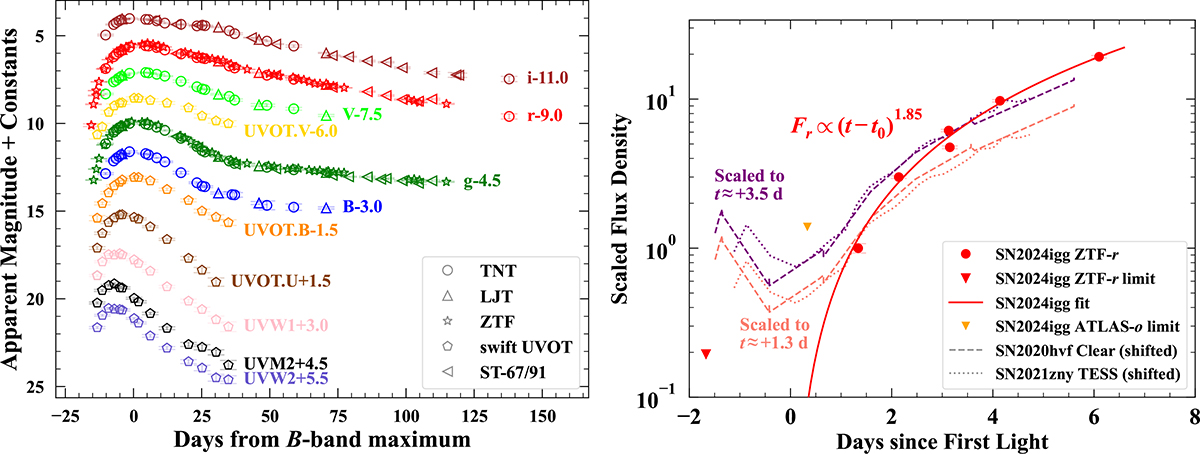
Left: UV and optical light curves of SN 2024igg. The phase is with respect to the B-band maximum (MJD = 60452.10; see Sect. 3.2). The data in different filters are shown with different colors and are shifted vertically for better display. The corresponding instruments are indicated in the legend. Right: Power-law fit to the early-time ZTF r-band light curve of SN 2024igg. The r-band data of SN 2024igg used to fit the power law are shown as red circles. The last non-detections from ZTF r and ATLAS o are plotted as inverted triangles. For comparison, the Clear-band data of SN 2020hvf and the TESS observations of SN 2021zny are shown as dotted and dashed-dotted lines, respectively. The flux densities of SN 2024igg are converted from observed magnitudes and are then scaled to the first detection point. For SNe 2020hvf and 2021zny, the phases are shifted to align their explosion time to the last non-detection of SN 2024igg in ZTF r, and their flux densities are scaled to match at +1.3 (salmon) and +3.5 days (purple).
Current usage metrics show cumulative count of Article Views (full-text article views including HTML views, PDF and ePub downloads, according to the available data) and Abstracts Views on Vision4Press platform.
Data correspond to usage on the plateform after 2015. The current usage metrics is available 48-96 hours after online publication and is updated daily on week days.
Initial download of the metrics may take a while.