


Fig. 5
Download original image
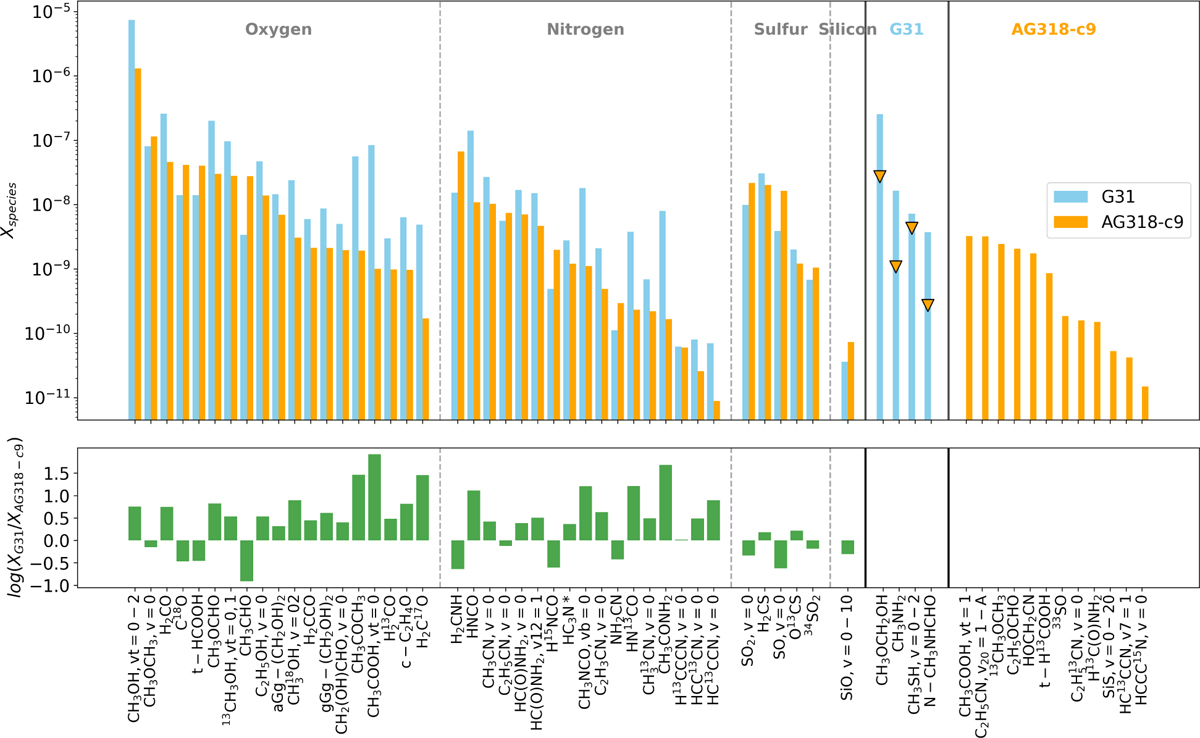
Top: comparison of molecular abundances (X = N/H2) towards G31 (blue bars) and AG318−c9 (orange bars), sorted by molecular groups and by the abundance of AG318−c9 inside each group. The species are grouped on the x-axis according to their detection status. Left: detected in both sources. Middle: detected in G31 alone. The orange triangles represent the corresponding upper limits for AG318−c9. Right: reported in AG318−c9. Bottom: logarithm of the ratio of the abundances of the two sources. HC3N* represents the group composed of HC3N, HC3N (v6 = 1), HC3N (v7 = 1), and HC3N (v7 = 2).
Current usage metrics show cumulative count of Article Views (full-text article views including HTML views, PDF and ePub downloads, according to the available data) and Abstracts Views on Vision4Press platform.
Data correspond to usage on the plateform after 2015. The current usage metrics is available 48-96 hours after online publication and is updated daily on week days.
Initial download of the metrics may take a while.