


Fig. 9.
Download original image
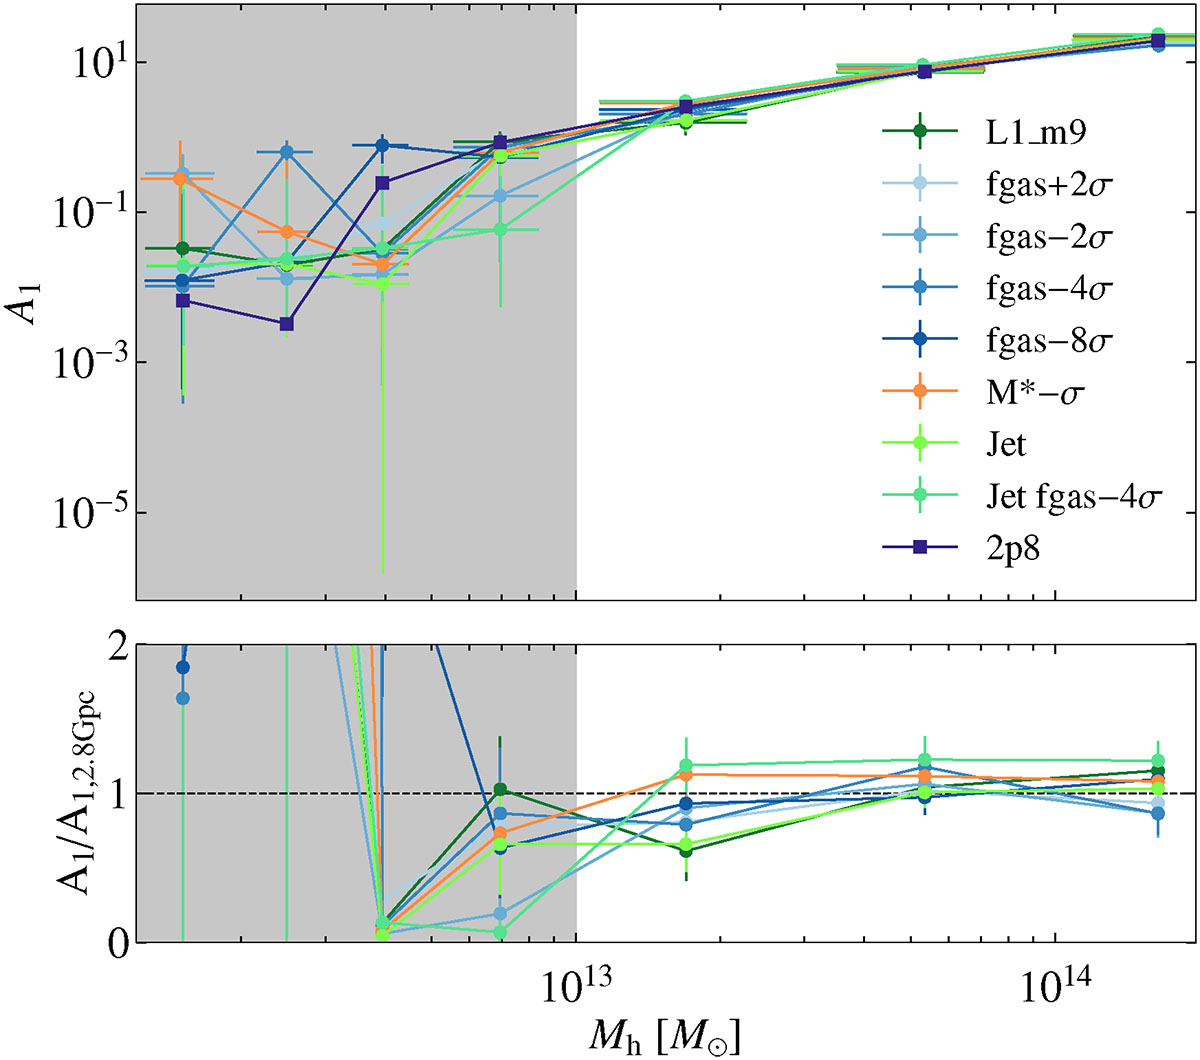
Top: Variation of TATT-A1 with halo mass for each feedback model. The values of A1 plotted are the best-fits with 1σ errors in each halo mass bin. The error bars on the x-axis are the standard deviation of mass in each bin. Bottom: Ratio of each feedback variation with the values from the 2.8 Gpc, which is the fiducial feedback variation. The grey region represent data points below a halo mass of 1013 M⊙, which are excluded from the fits for Fig. 10.
Current usage metrics show cumulative count of Article Views (full-text article views including HTML views, PDF and ePub downloads, according to the available data) and Abstracts Views on Vision4Press platform.
Data correspond to usage on the plateform after 2015. The current usage metrics is available 48-96 hours after online publication and is updated daily on week days.
Initial download of the metrics may take a while.