


Fig. 7.
Download original image
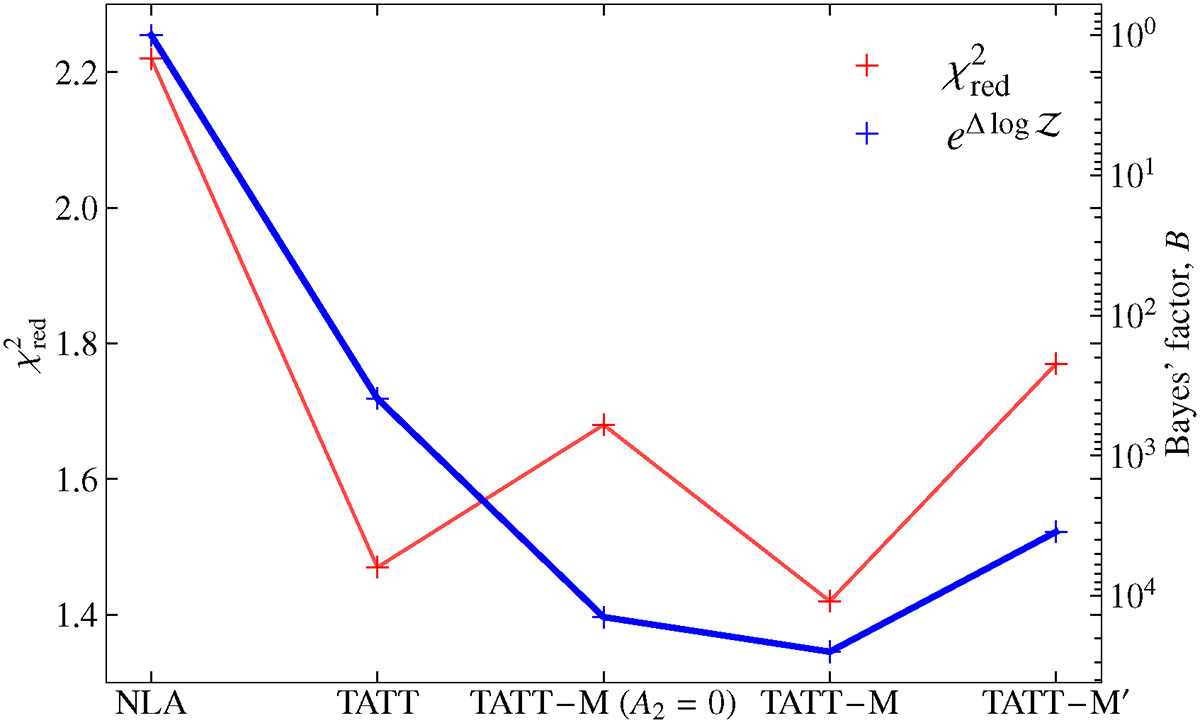
Values of the reduced chi-squared (χred2) and the Bayes’ factor relative to NLA for TATT, TATT-M (A2 = 0), TATT-M and TATT-M′. Our TATT-M model, based on an empirical fit to the halo data, is very strongly preferred over NLA on the central galaxy sample. TATT, TATT-M (A2 = 0) and TATT-M′ (based on empirical fits to the galaxy sample), are also preferred over NLA. There is a strong preference for the TATT-M model.
Current usage metrics show cumulative count of Article Views (full-text article views including HTML views, PDF and ePub downloads, according to the available data) and Abstracts Views on Vision4Press platform.
Data correspond to usage on the plateform after 2015. The current usage metrics is available 48-96 hours after online publication and is updated daily on week days.
Initial download of the metrics may take a while.