


Fig. 6.
Download original image
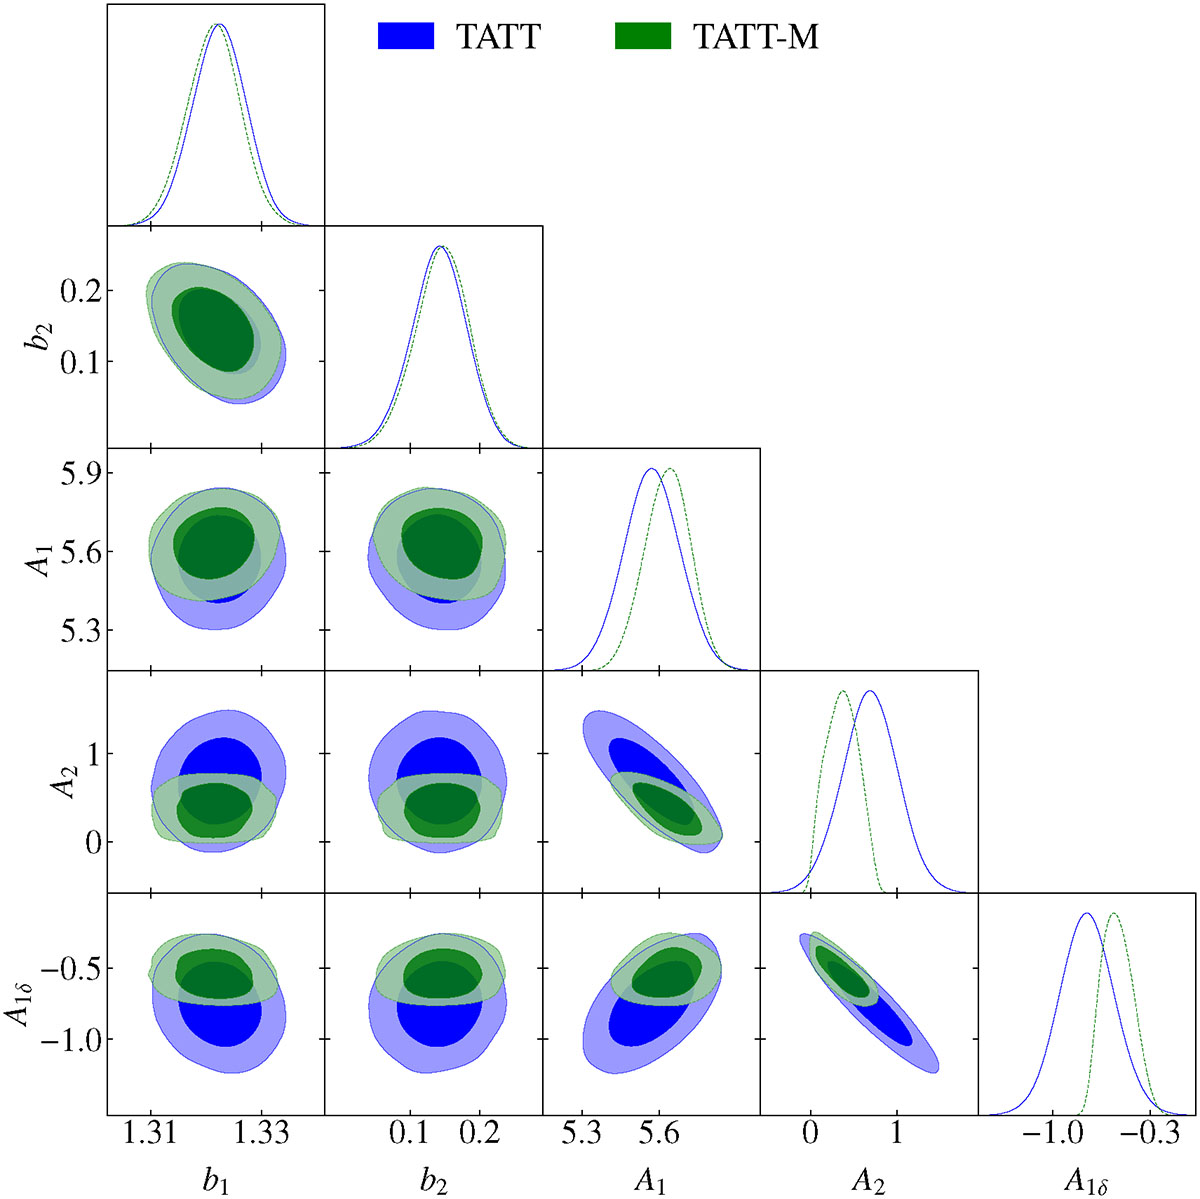
Corner plot of the posterior for the joint fit of galaxy clustering using non-linear bias and alignment signal using two models: TATT and TATT-M; over the scales 5–100 Mpc/h. TATT-M exploits empirically derived fitting functions between the TATT parameters and halo mass. The galaxy sample consists only of central galaxies, and the sampling was done by fitting b1, b2, A1, A2, and A1δ for TATT, and for TATT-M by replacing A2 and A1δ with k1, k2, and k3. These three extra parameters are sampled from the posterior of the fits to our halo sample, for which we have better statistics than for the galaxy sample. Due to the large amount of prior information, the overall constraining power is higher with our TATT-M model than with TATT. The posteriors on A2 and A1δ for TATT-M are derived using the relations in Eqs. 23 and 24. Note: these were not sampled and are shown here only for comparison.
Current usage metrics show cumulative count of Article Views (full-text article views including HTML views, PDF and ePub downloads, according to the available data) and Abstracts Views on Vision4Press platform.
Data correspond to usage on the plateform after 2015. The current usage metrics is available 48-96 hours after online publication and is updated daily on week days.
Initial download of the metrics may take a while.