


Fig. 5.
Download original image
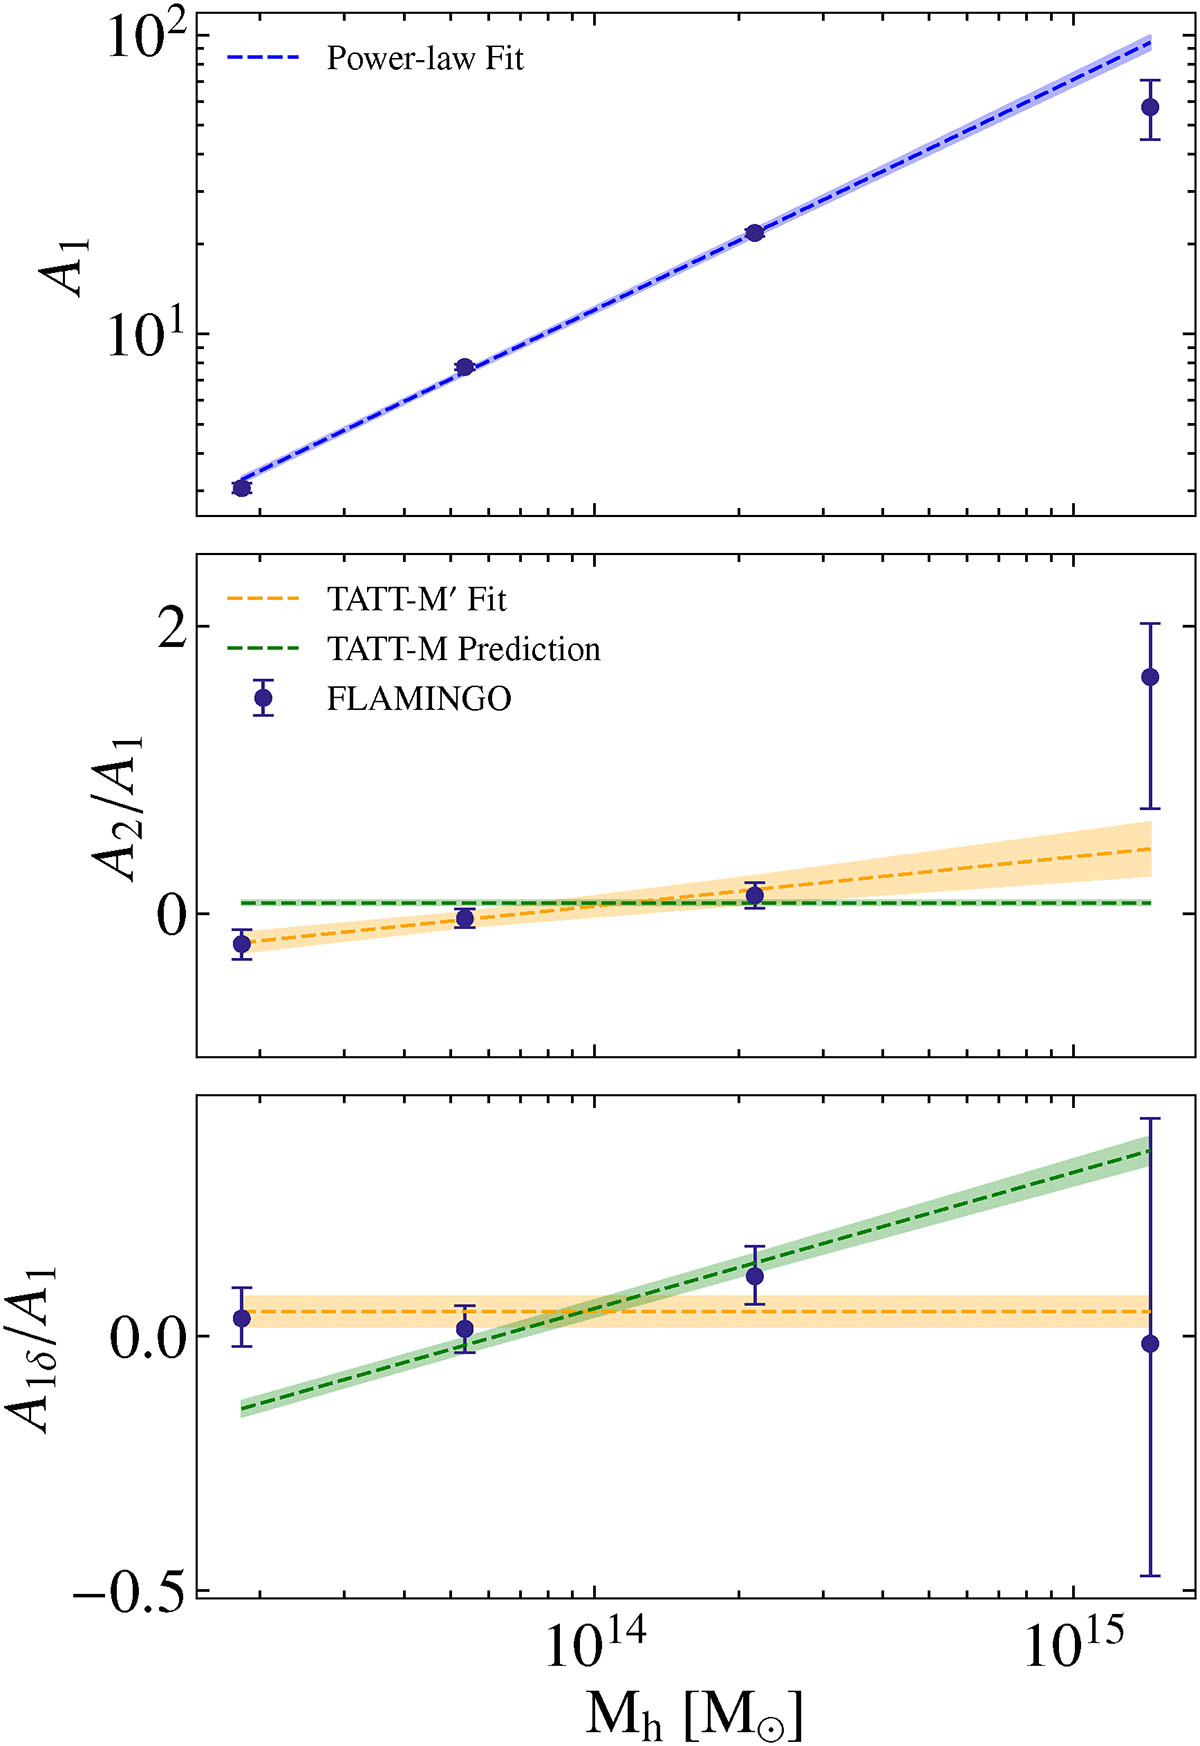
Variations in the TATT alignment amplitudes A1, A2, and A1δ with halo mass, Mh, (in our case, we use M200mean as the mass of the halo) for our central galaxy sample. Error bars on the bias parameter and amplitude were calculated by taking the 68th percentile values of the IA posteriors. Overplotted in green is the prediction for A2 and A1δ from our TATT-M model fit with error bars. Informed by the fits to the halo sample (Fig. A.3), we assume the relations in Eqs. 23 and 24 for the galaxy sample. In orange is the fit to the galaxy sample directly, which we refer to as TATT-M′.
Current usage metrics show cumulative count of Article Views (full-text article views including HTML views, PDF and ePub downloads, according to the available data) and Abstracts Views on Vision4Press platform.
Data correspond to usage on the plateform after 2015. The current usage metrics is available 48-96 hours after online publication and is updated daily on week days.
Initial download of the metrics may take a while.