


Fig. B.1.
Download original image
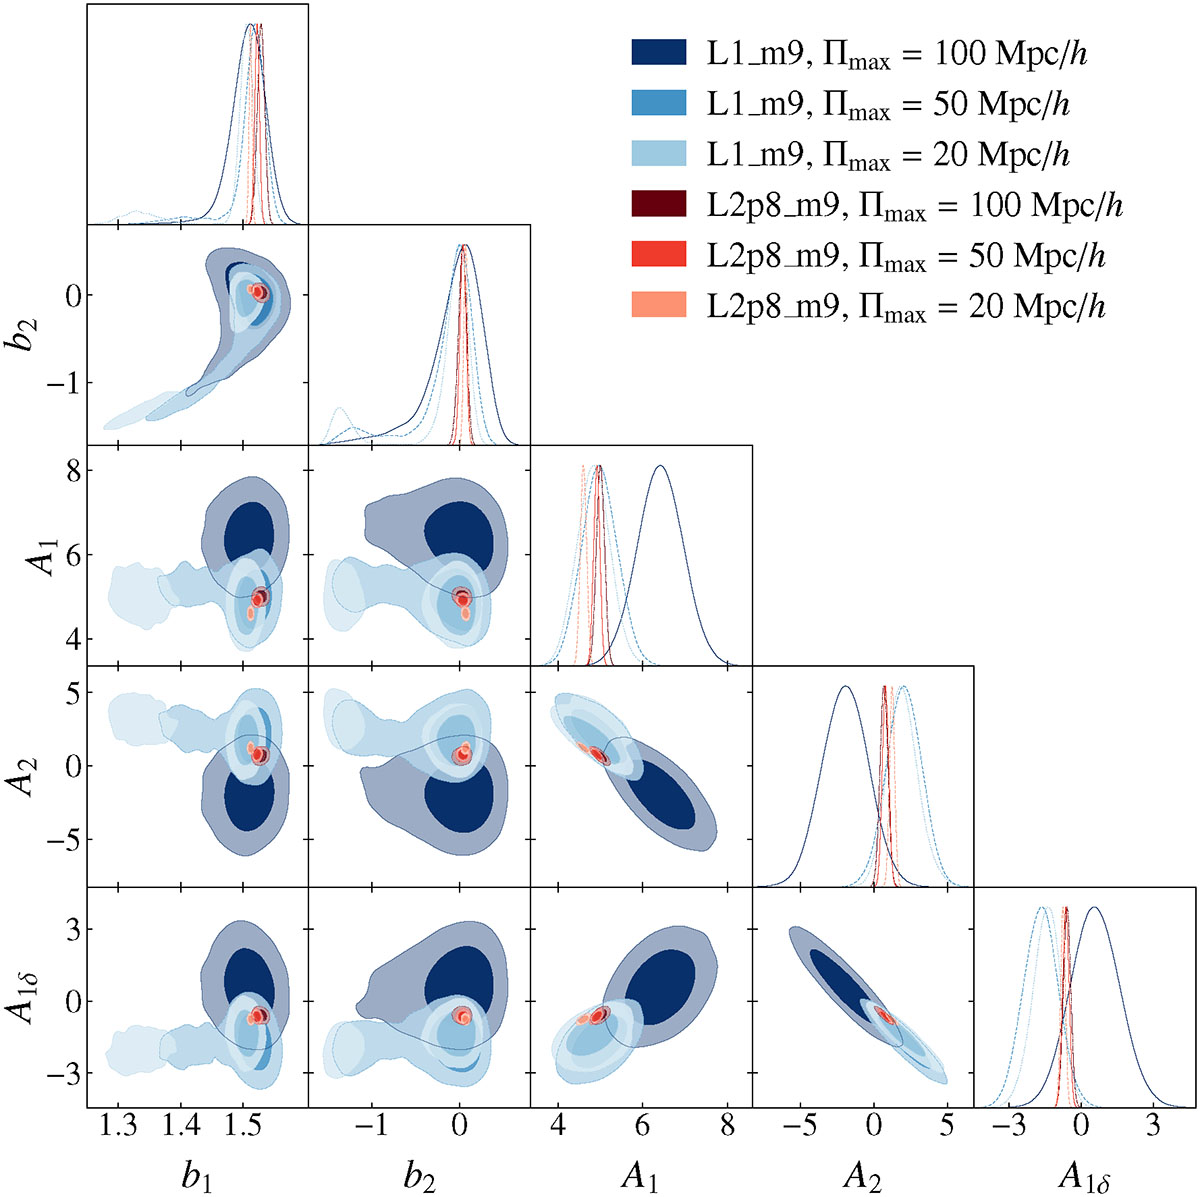
Posteriors of the joint fit of the clustering with non-linear bias and the alignment with TATT for different values of Πmax, for the 1 Gpc box (in blue) and the 2.8 Gpc box (in red). The darker the shade of blue/red, the higher the value of Πmax. Decreasing Πmax increases the S/N, and if there are sufficient statistics, different Πmax values give consistent answers. The degeneracy between b1 and b2 is exacerbated by smaller statistical power, and may even lead to biased results if too low a value of Πmax is chosen.
Current usage metrics show cumulative count of Article Views (full-text article views including HTML views, PDF and ePub downloads, according to the available data) and Abstracts Views on Vision4Press platform.
Data correspond to usage on the plateform after 2015. The current usage metrics is available 48-96 hours after online publication and is updated daily on week days.
Initial download of the metrics may take a while.