


Fig. 7.
Download original image
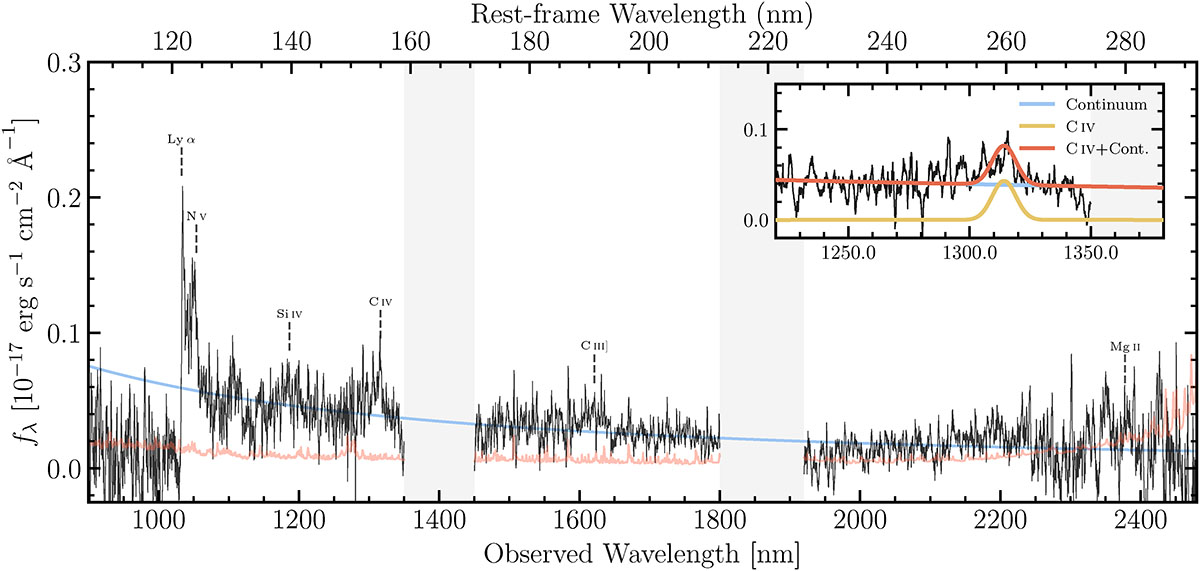
Magellan/FIRE echelle spectrum of EUCL J0522, one of the brightest z ∼ 7.5 quasars in this work (JE ≈ 22.17). The total integration time is 11 700 s. The black line shows the observed spectrum, inverse-variance smoothed with a 31 pixel boxcar. The light red curve shows the smoothed noise vector. The blue curve represents the best-fit power-law continuum. Locations of typical emission lines seen in a quasar spectrum are marked by vertical dashed lines, including Lyα, N V, Si IV, C IV, CIII], and Mg II. Grey shaded regions indicate wavelength ranges heavily affected by telluric absorption. The inset displays the C IV region with the best-fit emission-line model generated using Sculptor, showing the individual C IV component (yellow), continuum (blue), and combined fit (red).
Current usage metrics show cumulative count of Article Views (full-text article views including HTML views, PDF and ePub downloads, according to the available data) and Abstracts Views on Vision4Press platform.
Data correspond to usage on the plateform after 2015. The current usage metrics is available 48-96 hours after online publication and is updated daily on week days.
Initial download of the metrics may take a while.