


Fig. 9.
Download original image
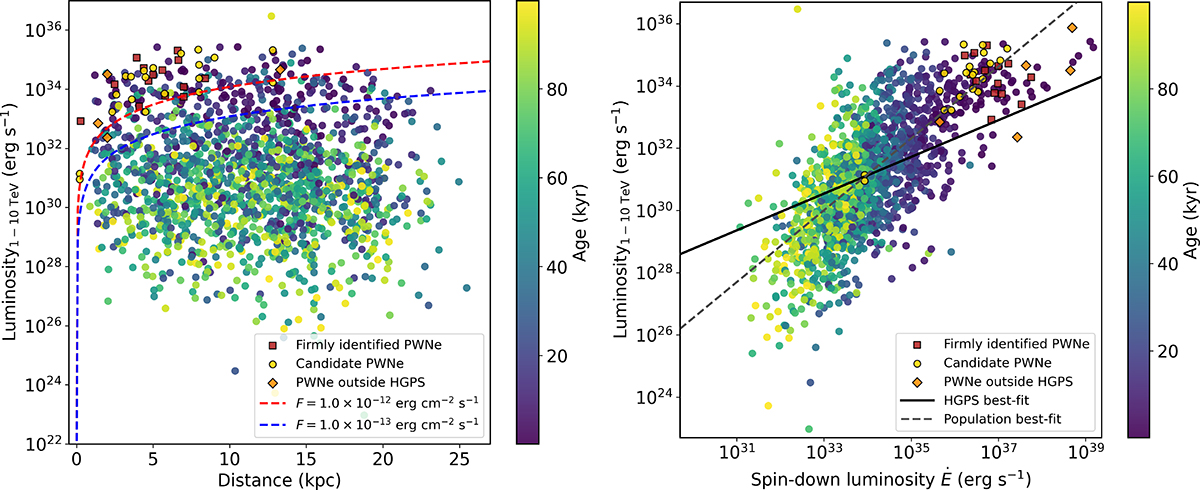
Distribution of integrated γ-ray luminosities in the 1-10 TeV band with source distance (left panel) and spin-down power (right panel) for a single random realization of synthetic population containing 1600 sources. In the left panel, the dashed red and blue curves signify the flux detection thresholds for H.E.S.S. (H. E. S. S. Collaboration 2018a) and CTAO (Abe et al. 2024), respectively. In the right panel, the solid line represents the slope corresponding to the L1−10 TeV − Ė relation, as obtained from H. E. S. S. Collaboration (2018b), whereas the dashed gray line represents that calculated from our population. The population distributions in all panels have been color-coded based on the current age of the corresponding sources. In all of these plots, firmly identified PWNe in HGPS (firebrick squares), candidate HGPS PWNe (gold circles), and PWNe outside HGPS (orange diamonds) are also shown.
Current usage metrics show cumulative count of Article Views (full-text article views including HTML views, PDF and ePub downloads, according to the available data) and Abstracts Views on Vision4Press platform.
Data correspond to usage on the plateform after 2015. The current usage metrics is available 48-96 hours after online publication and is updated daily on week days.
Initial download of the metrics may take a while.