


Fig. 8.
Download original image
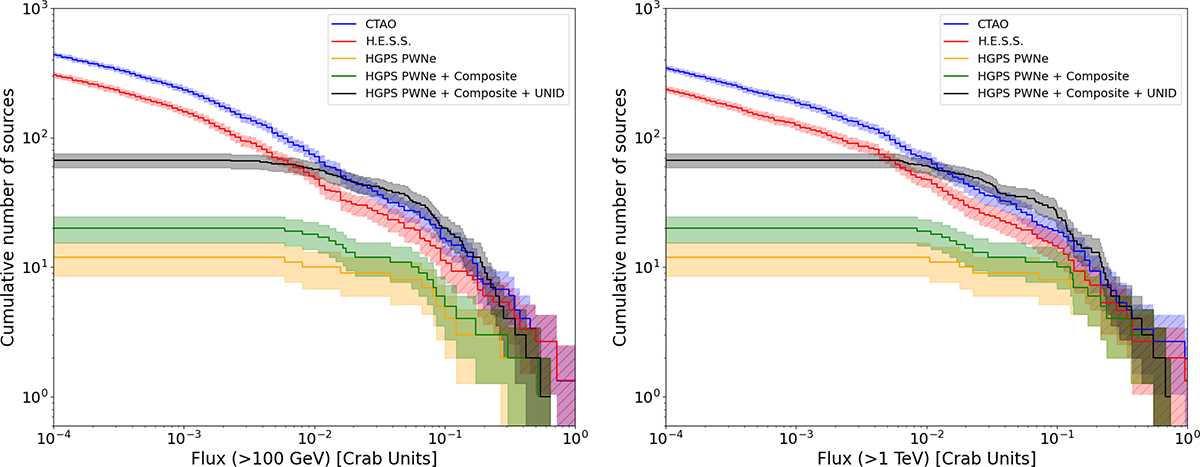
Mean cumulative flux distribution out of 1000 realizations of synthetic population containing 1600 sources emitting above two specific energies, i.e., > 100 GeV (left panel), and > 1 TeV (right panel). The flux has been normalized with respect to 1 Crab unit. The lighter colored areas represent the errors of each curve. In both plots, the mean distribution of sources across the realizations of the synthetic population within the CTAO (in blue) and H.E.S.S. (in red) footprints are directly compared with the firmly identified PWNe (in orange), the same added with PWNe in a composite SNR (in green), and the sum of these two with the known HGPS unidentified sources (in black).
Current usage metrics show cumulative count of Article Views (full-text article views including HTML views, PDF and ePub downloads, according to the available data) and Abstracts Views on Vision4Press platform.
Data correspond to usage on the plateform after 2015. The current usage metrics is available 48-96 hours after online publication and is updated daily on week days.
Initial download of the metrics may take a while.