


Fig. 7.
Download original image
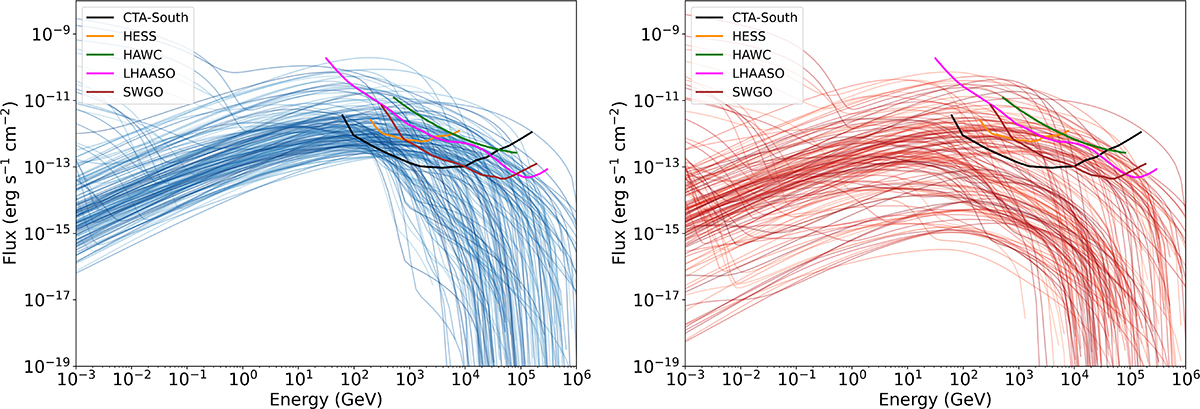
Comparison of the SEDs of sources predicted to be detectable by CTAO for a single random realization of the simulated population taking the reverberation effects into consideration. For each source, the SED obtained with TIDE+L (left) is compared with that of the corresponding source evolved with the simplified TIDE framework (right). The relevant instrumental sensitivity curves are also shown in both panels.
Current usage metrics show cumulative count of Article Views (full-text article views including HTML views, PDF and ePub downloads, according to the available data) and Abstracts Views on Vision4Press platform.
Data correspond to usage on the plateform after 2015. The current usage metrics is available 48-96 hours after online publication and is updated daily on week days.
Initial download of the metrics may take a while.