


Fig. 6.
Download original image
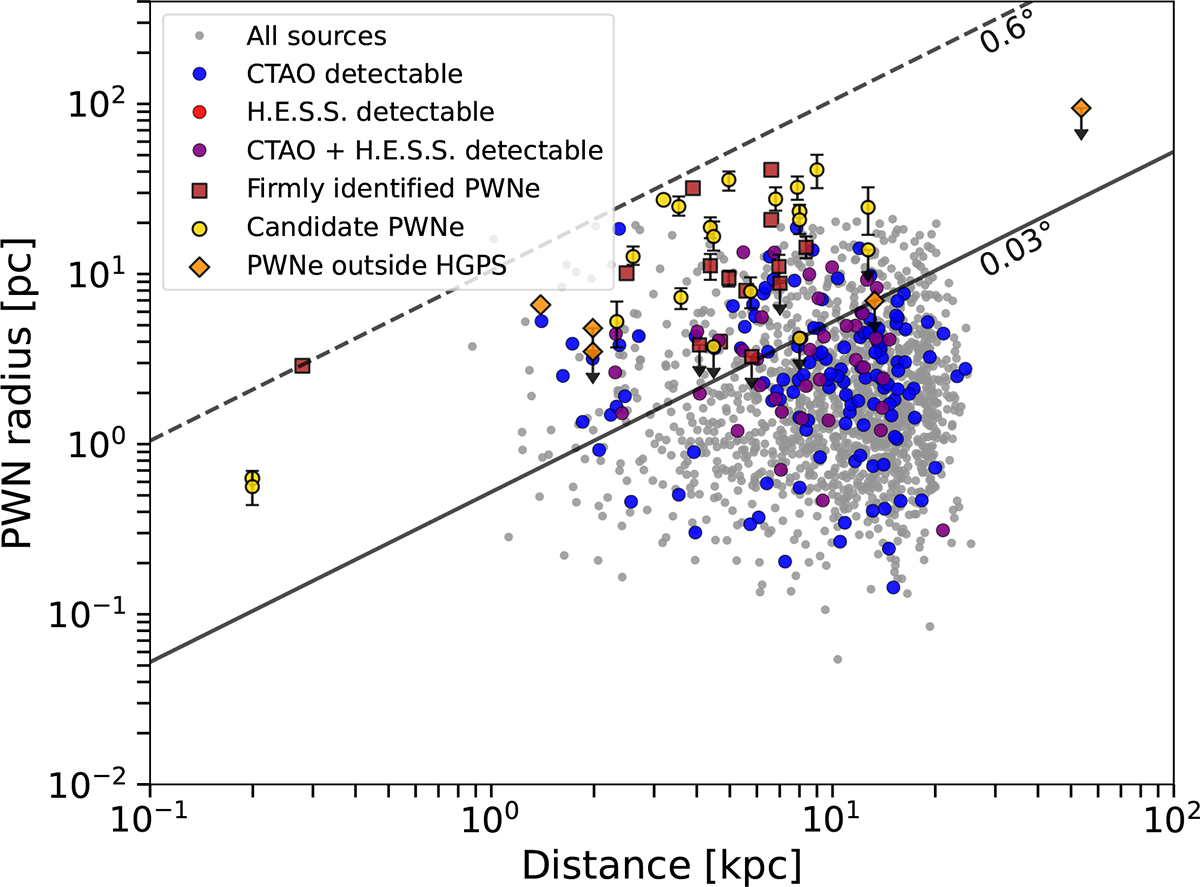
Current PWN radius versus distance plot for a single random realization of the synthetic population containing 1600 sources. The red circles (if any) denote the sources that will be detectable by H.E.S.S., the blue circles represent the detectable sources by CTAO, and the purple circles denote sources that will be detectable by both. The gray circles signify the rest of the population. The dashed and solid lines represent the maximum and minimum angular extension, respectively, as posited by H. E. S. S. Collaboration (2018b) from HGPS-detected PWNe. In the plot, firmly identified PWNe in the HGPS (firebrick squares), candidate HGPS PWNe (gold circles), and PWNe outside the HGPS (orange diamonds) are also shown.
Current usage metrics show cumulative count of Article Views (full-text article views including HTML views, PDF and ePub downloads, according to the available data) and Abstracts Views on Vision4Press platform.
Data correspond to usage on the plateform after 2015. The current usage metrics is available 48-96 hours after online publication and is updated daily on week days.
Initial download of the metrics may take a while.