


Fig. 5.
Download original image
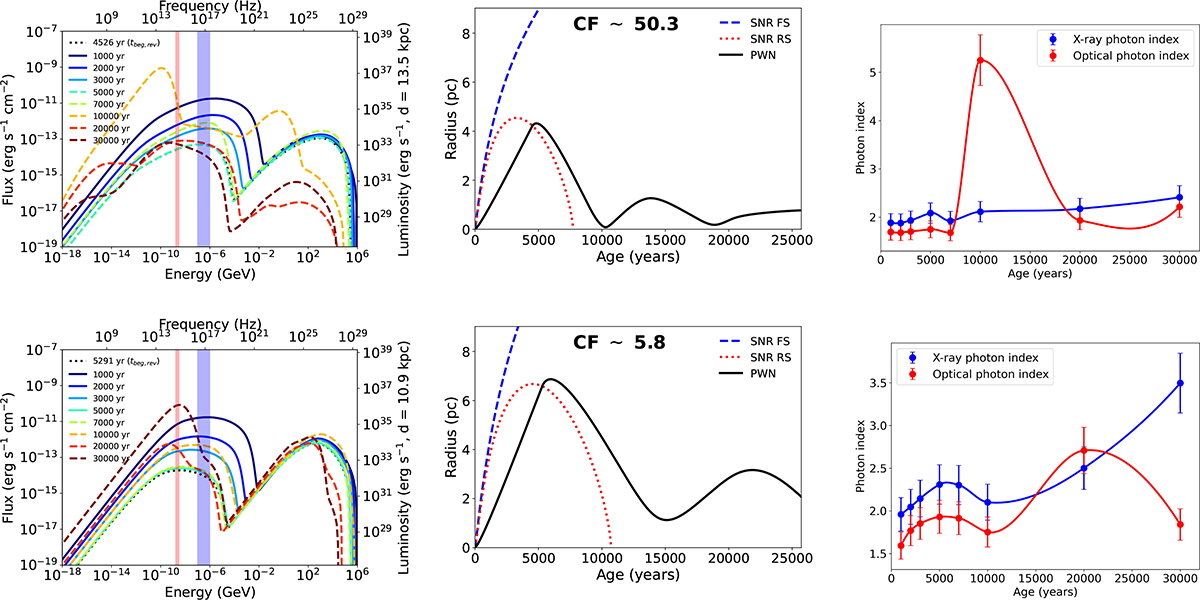
Results of the individual source simulations based on the CF are shown in this figure. The upper (lower) row corresponds to example 1 (example 2). The left panel in each row shows the evolution of the SED with time. The solid (dashed) lines correspond to the SED before (after) the reverberation, whereas the dotted line corresponds to the SED at the reverberation age (tbeg, rev). The shaded red (blue) region signifies the energy range in which the optical (X-ray) photon index is calculated. The middle panel shows the time evolution of the radius of the PWN, SNR forward and reverse shocks. In the right panel, we show the time evolution of the optical (X-ray) photon index in red (blue) for both sources, while also providing 10% error bars for all photon index values.
Current usage metrics show cumulative count of Article Views (full-text article views including HTML views, PDF and ePub downloads, according to the available data) and Abstracts Views on Vision4Press platform.
Data correspond to usage on the plateform after 2015. The current usage metrics is available 48-96 hours after online publication and is updated daily on week days.
Initial download of the metrics may take a while.