


Fig. 4.
Download original image
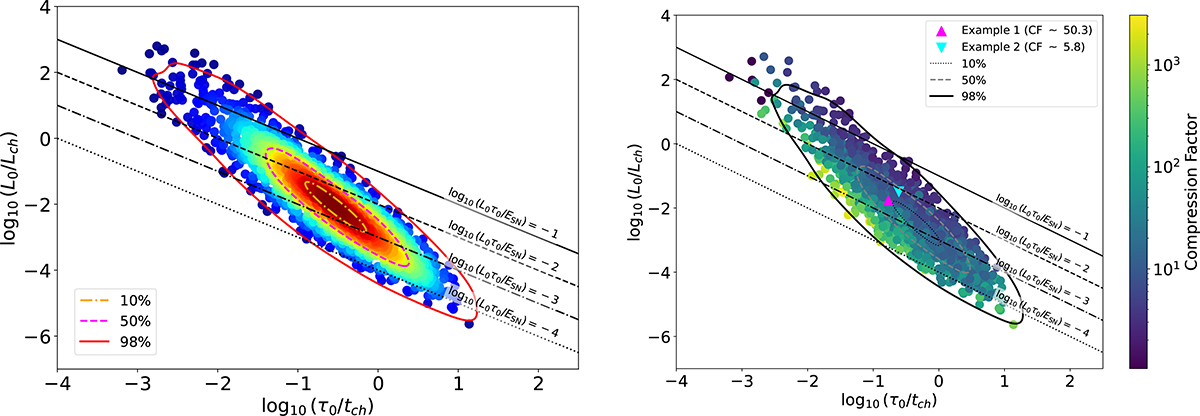
The distribution of the population on the characteristic log10(L0/Lch)–log10(τ0/tch) plane. The left panel shows a single random realization of the synthetic PWN population containing 1600 sources on the plane, with ellipses marking the isolevels enclosing 10, 50, and 98 percent of the population. Each point is color-coded by density, derived from Gaussian KDE, with colors ranging from red (denser regions) to blue (sparser ones). The right panel displays the same plane along with the isolevels, but color-coded by the CF (CF = Rmax/Rmin) at the first compression, as indicated in the color bar. In this plot, only PWNe in the post-compression phase are shown. Colored triangles in this plot highlight two example PWNe within a 50% enclosing ellipse with different CFs used for individual simulations. Straight lines in both plots denote loci of four constant pulsar–SNR energetics.
Current usage metrics show cumulative count of Article Views (full-text article views including HTML views, PDF and ePub downloads, according to the available data) and Abstracts Views on Vision4Press platform.
Data correspond to usage on the plateform after 2015. The current usage metrics is available 48-96 hours after online publication and is updated daily on week days.
Initial download of the metrics may take a while.