


Fig. 3.
Download original image
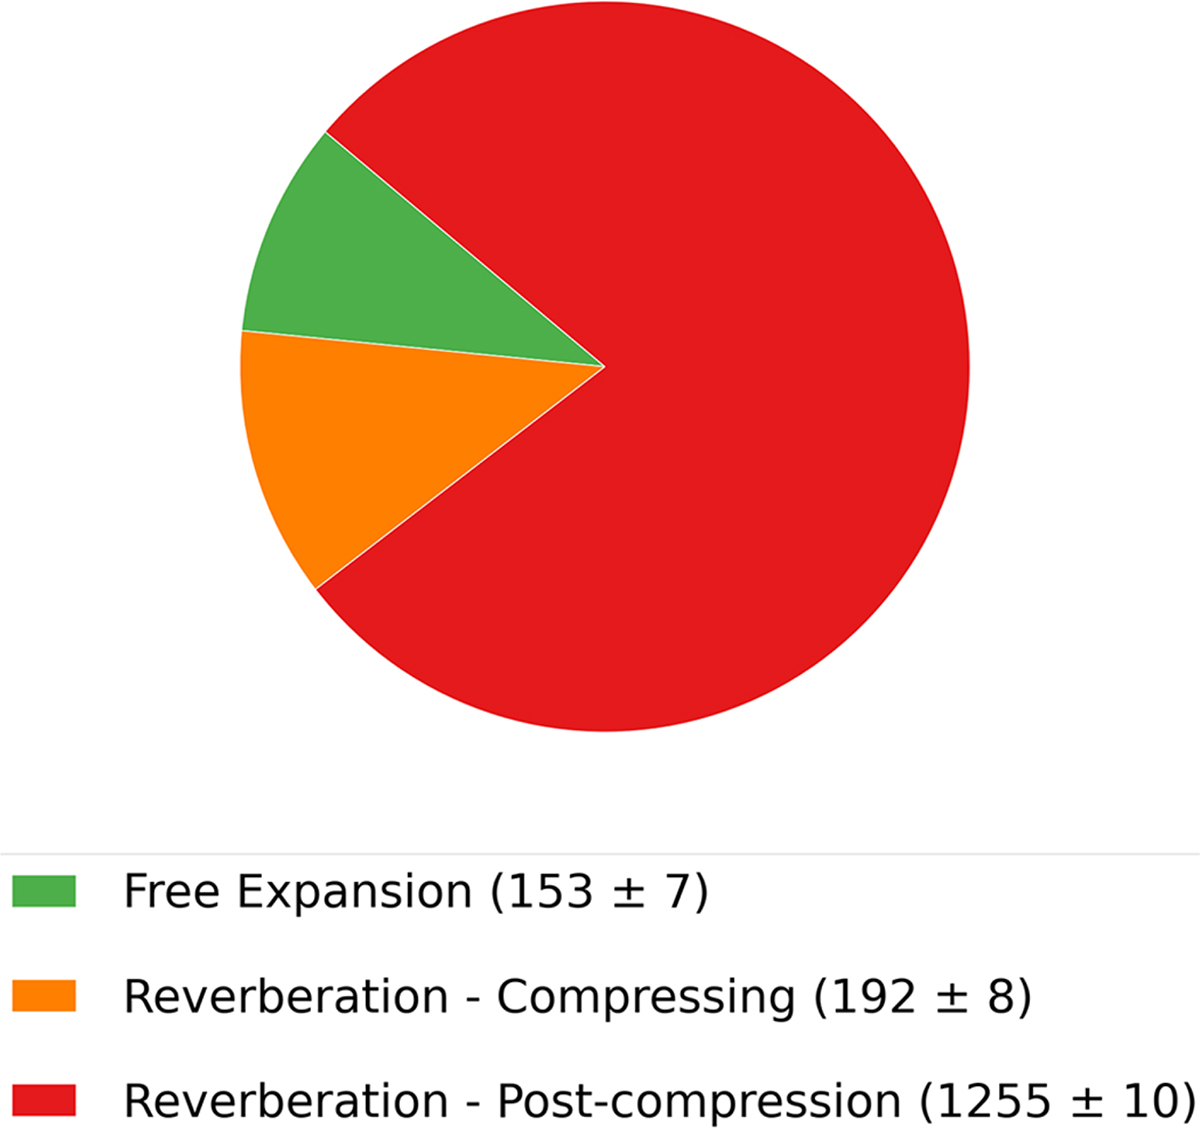
Pie chart distinguishing sources in free expansion (green), reverberation in the compressing phase (orange), and reverberation in the post-compression phase (red). The plotted counts correspond to the mean number of sources in each evolutionary stage, obtained by averaging over 1000 realizations of 1600 randomly drawn PWNe at the final simulation time. The 1σ uncertainties for each phase are also provided in the legend.
Current usage metrics show cumulative count of Article Views (full-text article views including HTML views, PDF and ePub downloads, according to the available data) and Abstracts Views on Vision4Press platform.
Data correspond to usage on the plateform after 2015. The current usage metrics is available 48-96 hours after online publication and is updated daily on week days.
Initial download of the metrics may take a while.