


Fig. 2.
Download original image
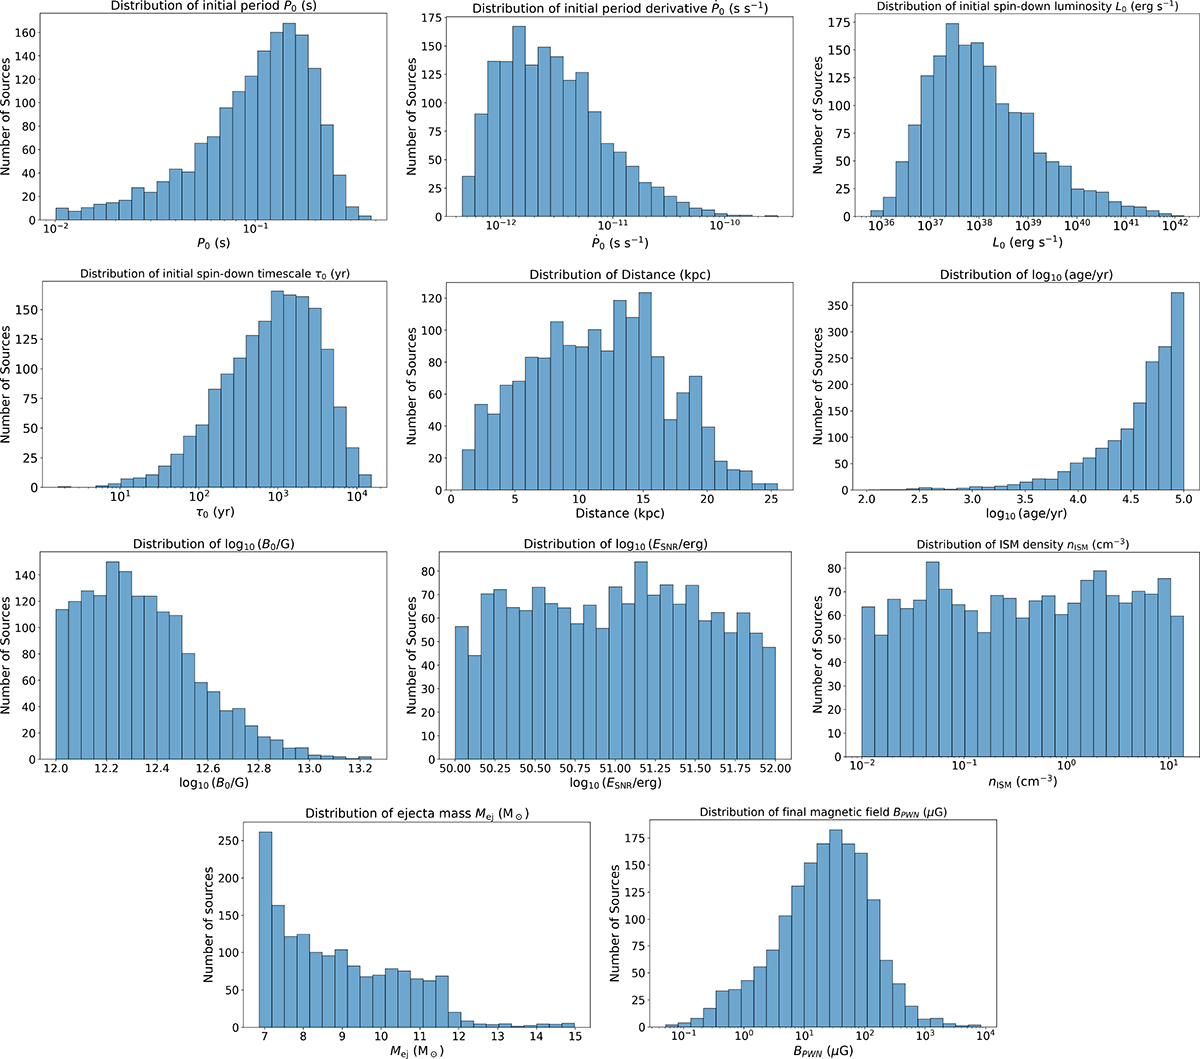
Histograms of the parameter distributions employed in this work. Each histogram shows the mean number of sources per bin, obtained by averaging the bin counts over 1000 random realizations, each built by drawing 1600 PWNe without replacement from the full synthetic parent population of 2400 systems. The bin-by-bin uncertainty corresponds to the 1σ scatter among realizations, and typically ranges from ≈7% to ≈15% for the parameters shown. Note that the final magnetic field distribution, BPWN, shown in the figure was not assumed a priori, but instead emerges from the simulation. The histogram was constructed using the PWN magnetic field evaluated at the current age of each source.
Current usage metrics show cumulative count of Article Views (full-text article views including HTML views, PDF and ePub downloads, according to the available data) and Abstracts Views on Vision4Press platform.
Data correspond to usage on the plateform after 2015. The current usage metrics is available 48-96 hours after online publication and is updated daily on week days.
Initial download of the metrics may take a while.