


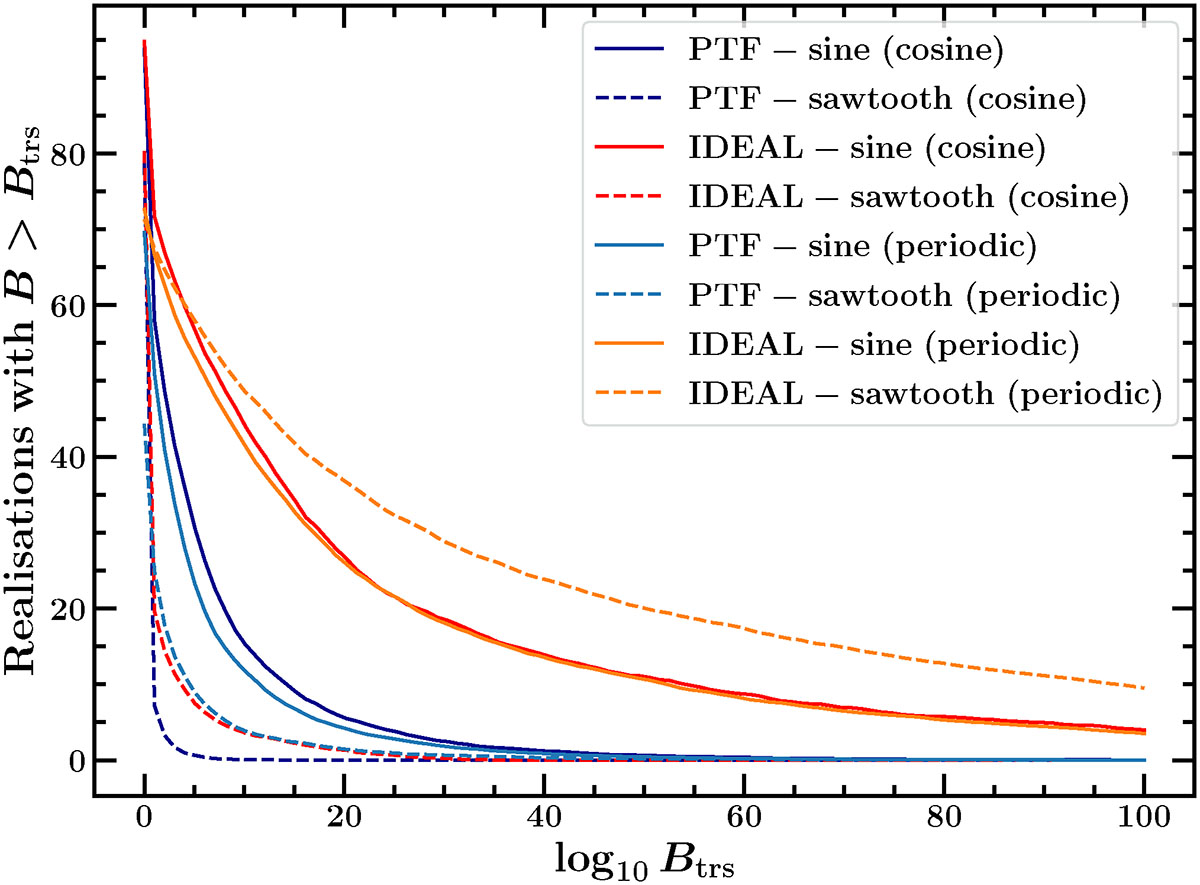
Fig. 8.
Download original image
Comparison of the fraction of realisations with a Bayes factor greater than a threshold as a function of the assumed threshold found using the cosine or generic periodic kernels. Dark blue and red lines show the results obtained with the cosine kernel for the PTF and ideal baselines, respectively. Blue and orange lines show the results obtained with the generic periodic kernel for the PTF and ideal baselines, respectively. Solid lines refer to sinusoidal modulations while dashed lines refers to sawtooth modulations.
Current usage metrics show cumulative count of Article Views (full-text article views including HTML views, PDF and ePub downloads, according to the available data) and Abstracts Views on Vision4Press platform.
Data correspond to usage on the plateform after 2015. The current usage metrics is available 48-96 hours after online publication and is updated daily on week days.
Initial download of the metrics may take a while.