


Fig. 7.
Download original image
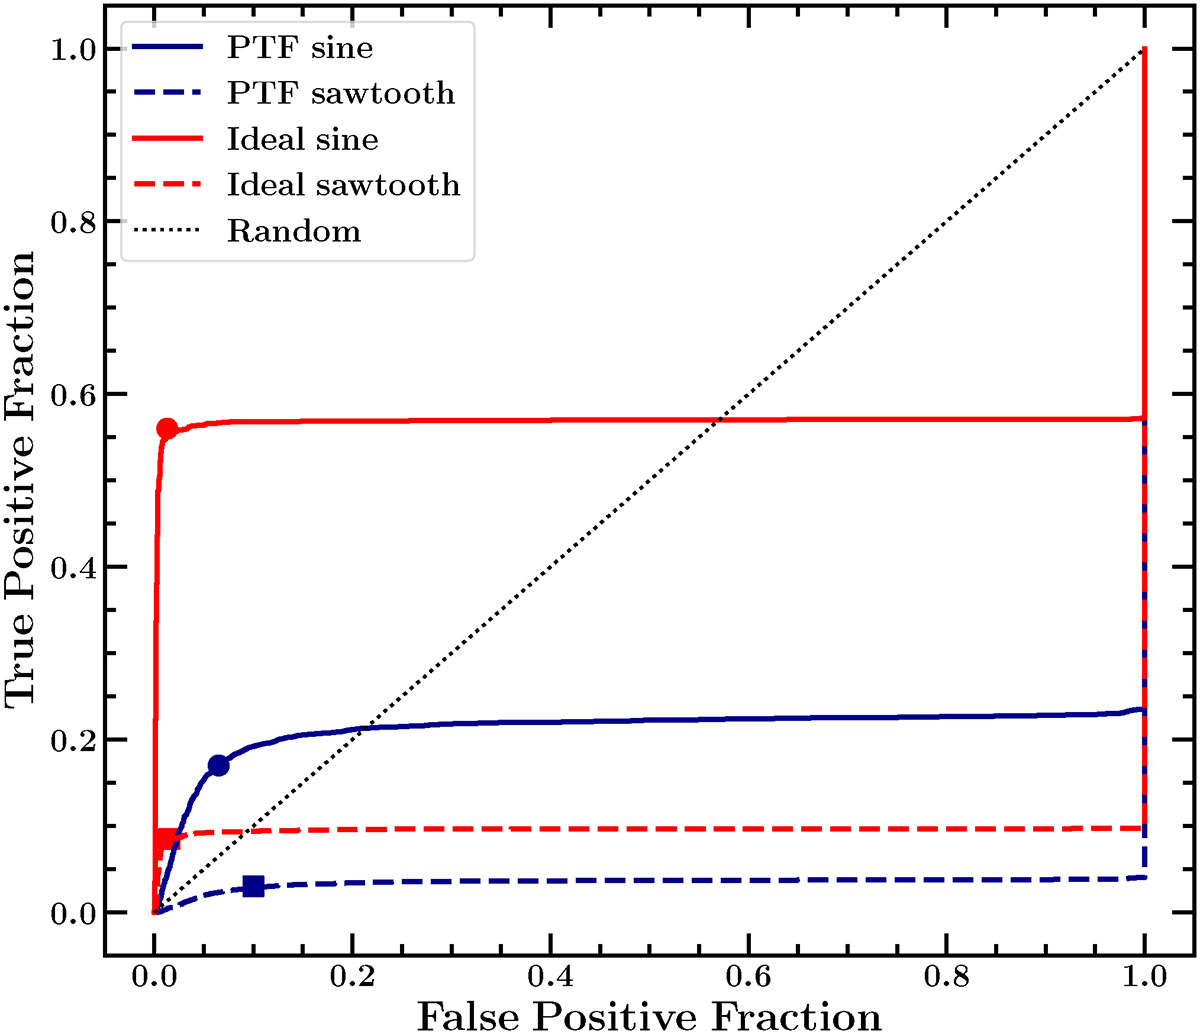
Different combinations of baselines and periodicity shape found using the cosine kernel (ROC curves). The solid lines show sinusoidal light curves, and the dashed lines show sawtooth light curves. The blue lines show the PTF-like baseline, and the red lines show the idealised baseline. The circles and squares identify the points at the identified Bayes threshold for the sinusoidal and sawtooth cases, respectively. The blue markers show PTF-like light curves, and red markers show ideal light curves.
Current usage metrics show cumulative count of Article Views (full-text article views including HTML views, PDF and ePub downloads, according to the available data) and Abstracts Views on Vision4Press platform.
Data correspond to usage on the plateform after 2015. The current usage metrics is available 48-96 hours after online publication and is updated daily on week days.
Initial download of the metrics may take a while.