


Fig. 6.
Download original image
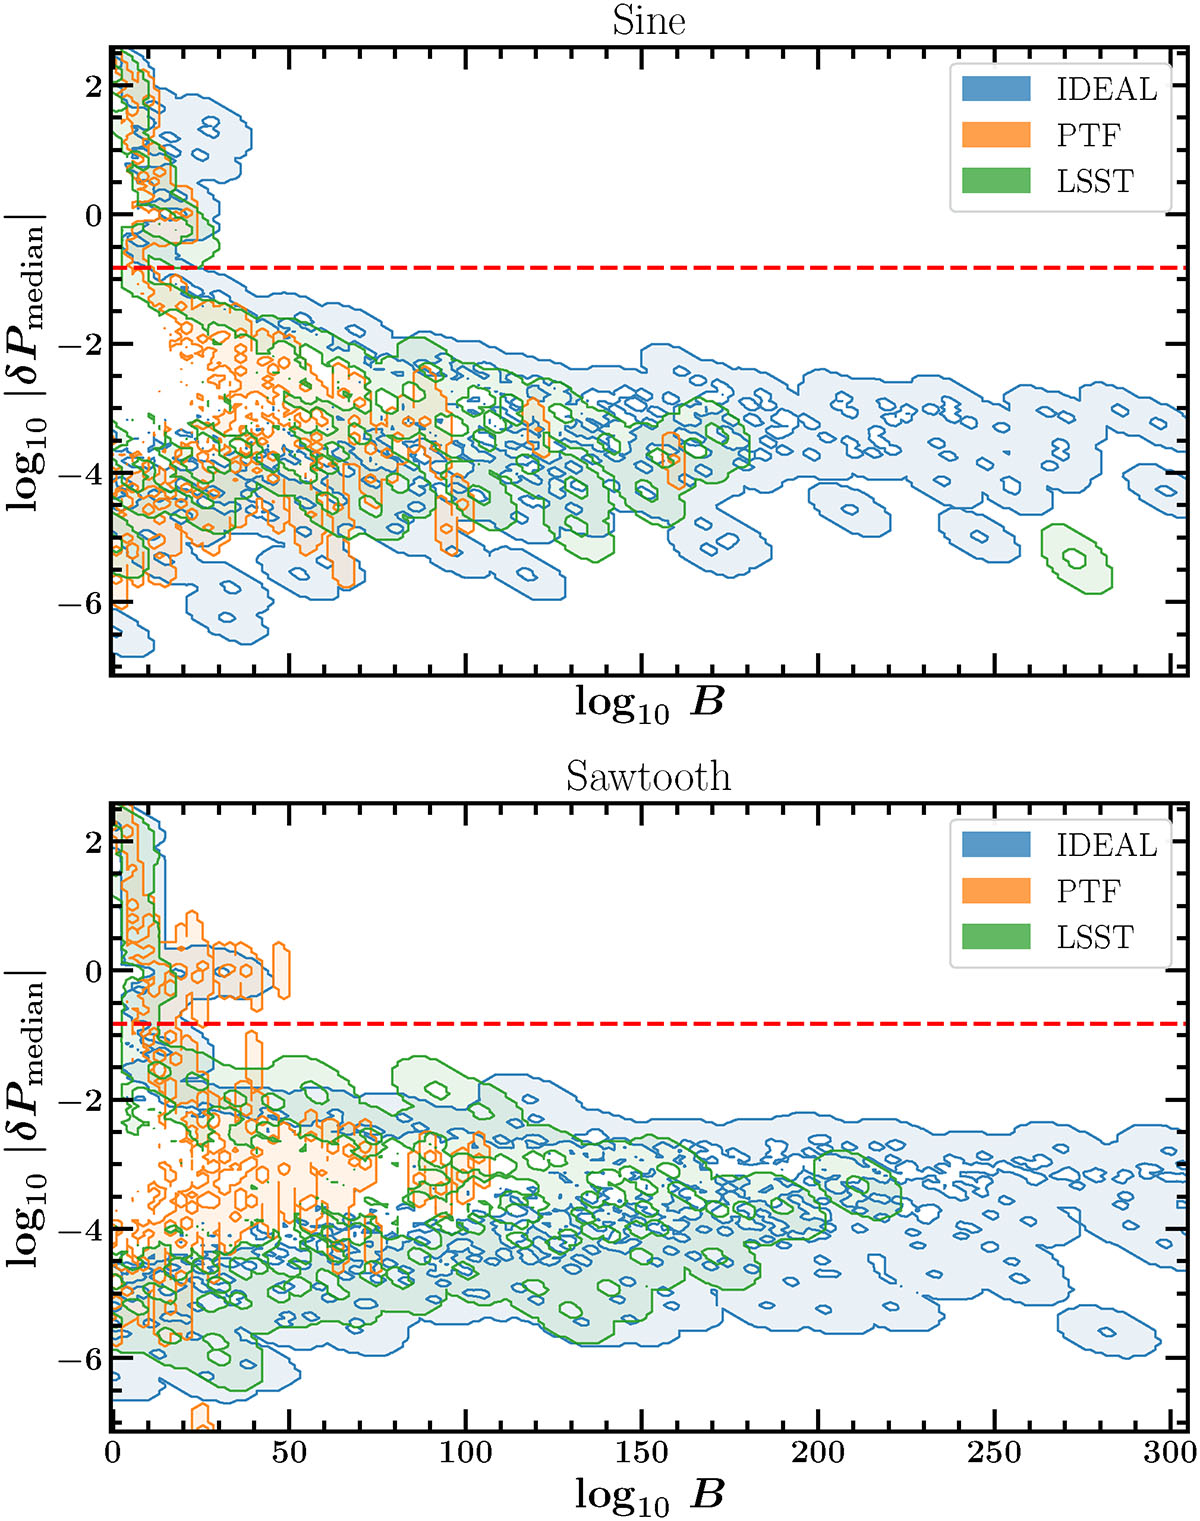
Absolute value of the relative period recovery error as a function of the base-10 logarithm Bayes factor, shown as density contours at the 25th and 75th percentile levels obtained through Gaussian kernel density estimation. The blue, orange, and green markers show the ideal, PTF and LSST baselines, respectively. The horizontal dashed red line shows a reference value |δP| = 0.15. The upper panel shows sinusoidal light curves, and the lower panel shows sawtooth light curves.
Current usage metrics show cumulative count of Article Views (full-text article views including HTML views, PDF and ePub downloads, according to the available data) and Abstracts Views on Vision4Press platform.
Data correspond to usage on the plateform after 2015. The current usage metrics is available 48-96 hours after online publication and is updated daily on week days.
Initial download of the metrics may take a while.