


Fig. 4.
Download original image
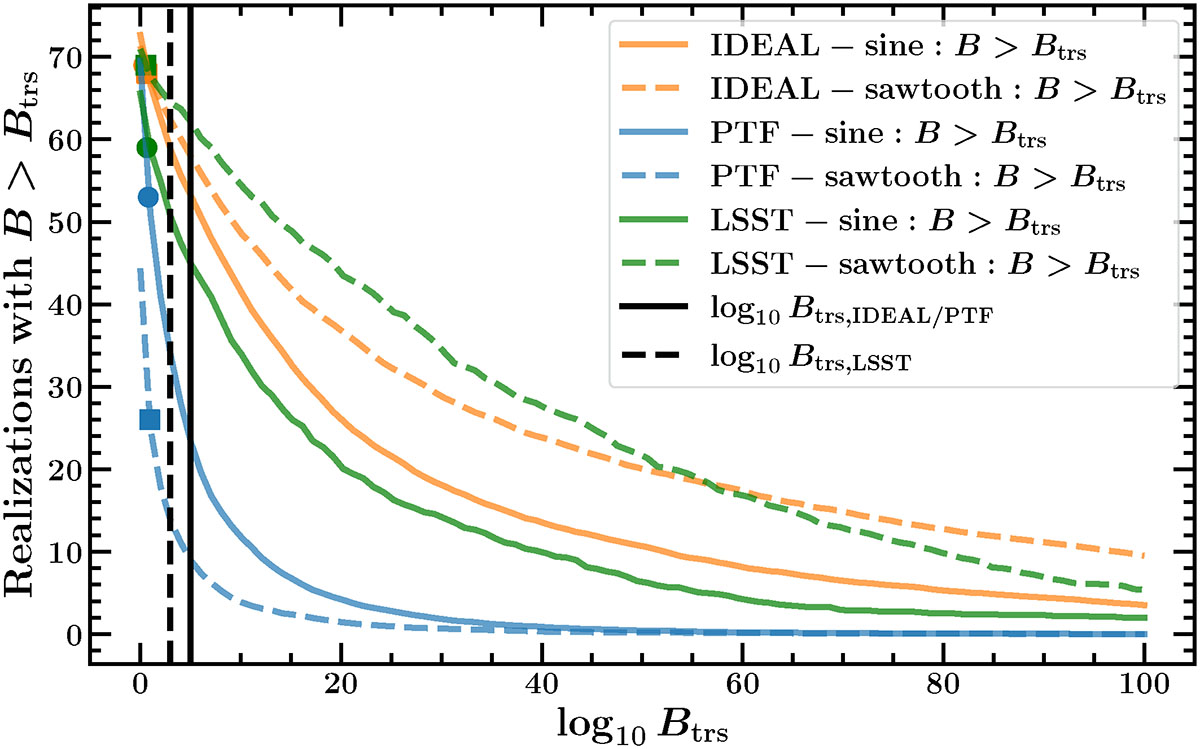
Fraction of the realisation containing periodic signals with a Bayes factor greater than a threshold as a function of the assumed threshold. The solid lines show the sinusoidal light curves, and the dotted lines show sawtooth light curves. Orange, blue and green show the ideal, PTF, and LSST baselines, respectively. The vertical lines show the Bayes factor threshold of log10Btrs = 5 for the ideal, PTF (solid line), and log10Btrs = 3 for the LSST baseline (dashed line) used to compare the results with the LSP analysis (see Section 3.5). The circles and squares identify the points at the identified ROC curve-based Bayes threshold for the sinusoidal and sawtooth cases, respectively. The orange markers show ideal-like light curves, blue markers show PTF-like light curves, and finally, green markers show LSST-like light curves.
Current usage metrics show cumulative count of Article Views (full-text article views including HTML views, PDF and ePub downloads, according to the available data) and Abstracts Views on Vision4Press platform.
Data correspond to usage on the plateform after 2015. The current usage metrics is available 48-96 hours after online publication and is updated daily on week days.
Initial download of the metrics may take a while.