


Fig. 3.
Download original image
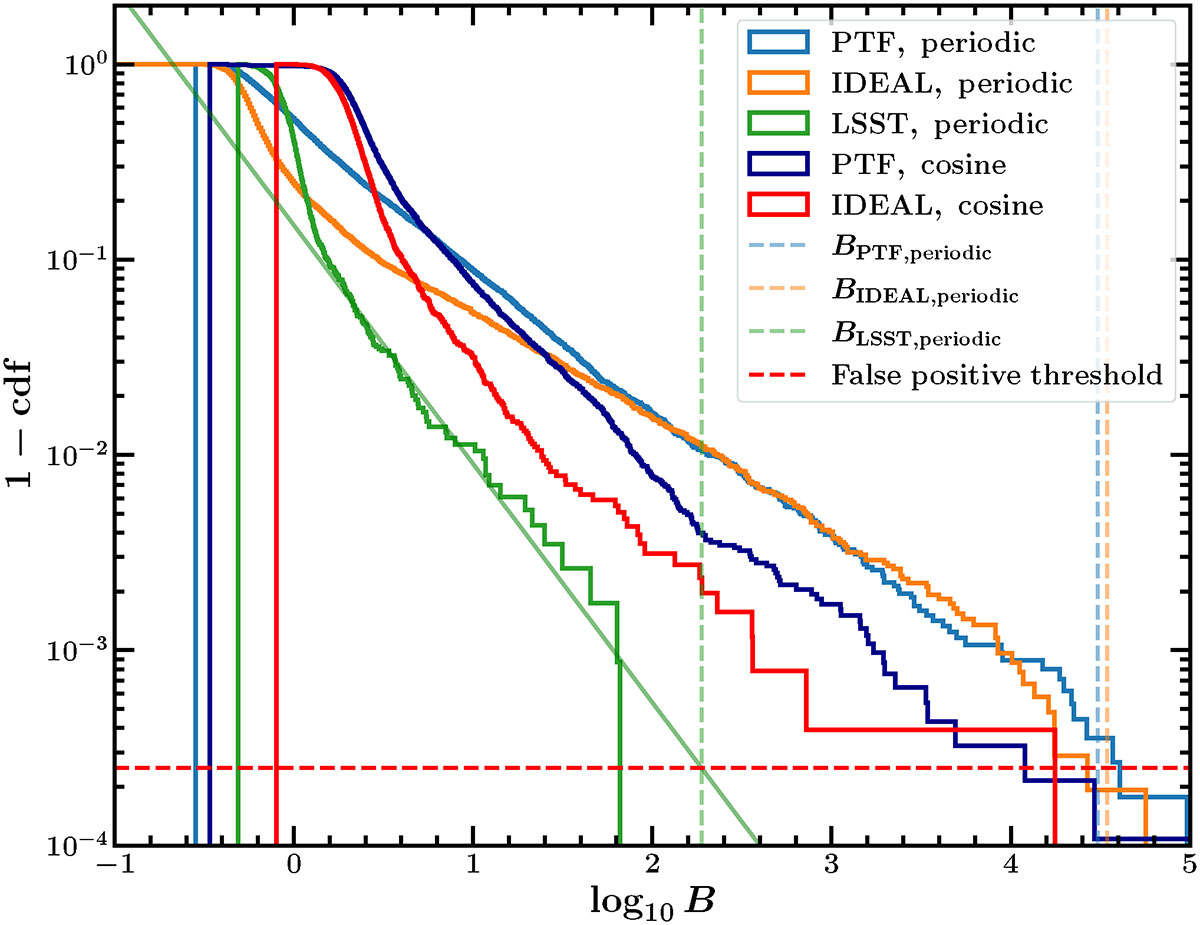
Distribution of the Bayes factors for the 104 noise-only light curves for the PTF using the periodic kernel and cosine kernel (blue and dark blue distributions) and ideal using the periodic kernel and cosine kernel (orange and red distributions) baselines, and the 103 noise-only light curves for the LSST (green distribution) baseline found by analysing the light curves with the generic periodic kernel. The vertical lines refer to the Bayes factor threshold identified for a fair comparison with the LSP analysis discussed in more detail in Section 3.5.
Current usage metrics show cumulative count of Article Views (full-text article views including HTML views, PDF and ePub downloads, according to the available data) and Abstracts Views on Vision4Press platform.
Data correspond to usage on the plateform after 2015. The current usage metrics is available 48-96 hours after online publication and is updated daily on week days.
Initial download of the metrics may take a while.