


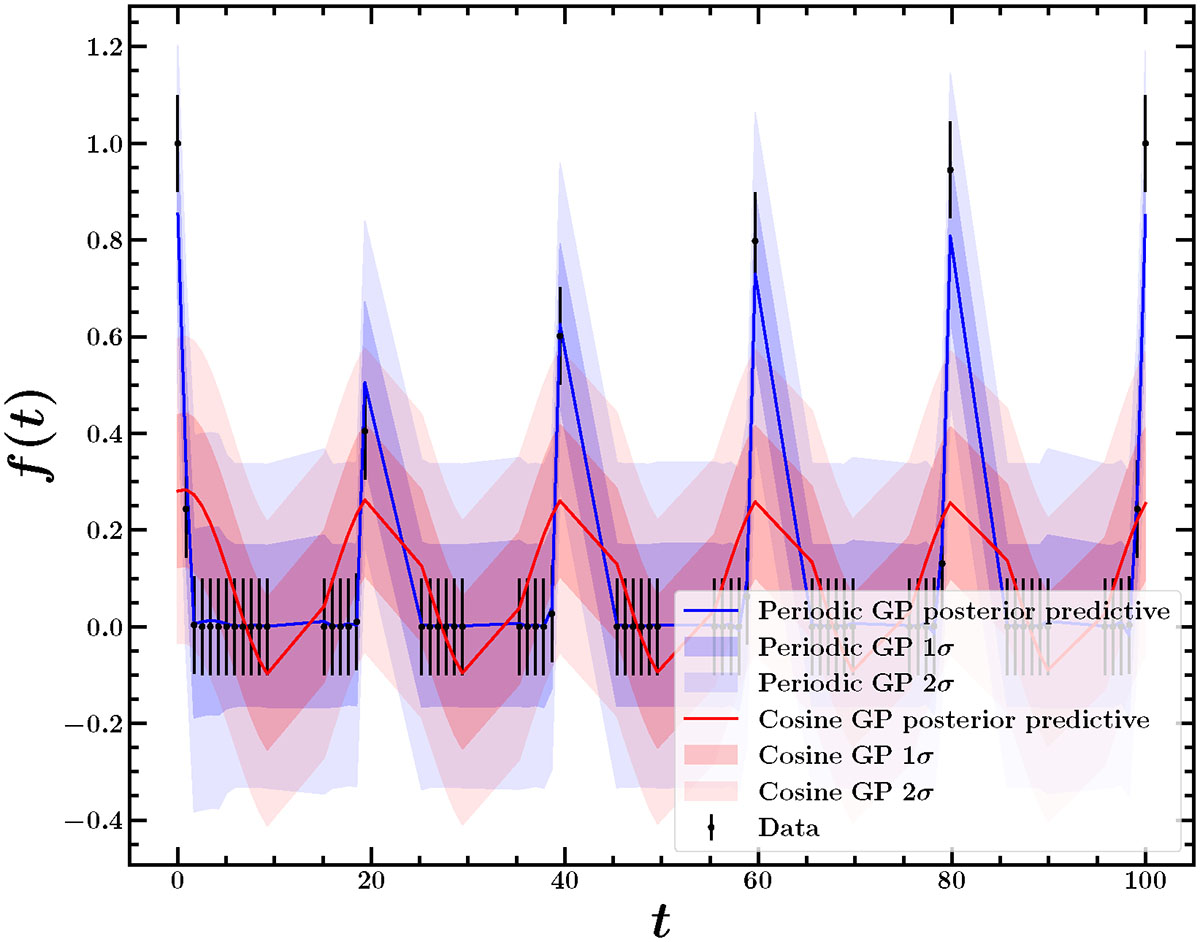
Fig. B.2.
Download original image
Posterior predictive distributions obtained by fitting a "spiky" light curve using the cosine kernel (red solid line and shaded region) and periodic kernel (blue solid line and shaded region) defined in Equations 7 and 8, respectively. The light curve is made sparser with respect to the light curve shown in Figure B.1 by the introduction of gaps in the data. The time t and signal f(t) are reported in arbitrary units.
Current usage metrics show cumulative count of Article Views (full-text article views including HTML views, PDF and ePub downloads, according to the available data) and Abstracts Views on Vision4Press platform.
Data correspond to usage on the plateform after 2015. The current usage metrics is available 48-96 hours after online publication and is updated daily on week days.
Initial download of the metrics may take a while.