


Fig. 2.
Download original image
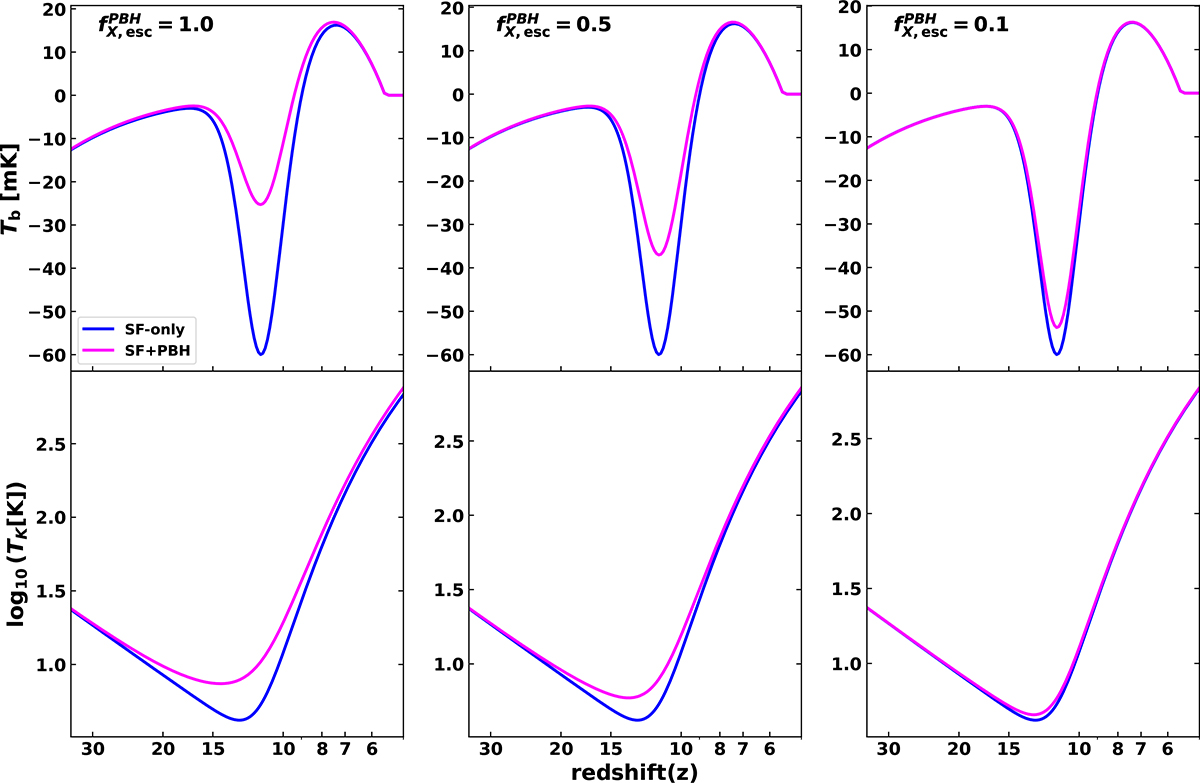
Top Panel: Redshift evolution of the global 21 cm signal for different values of  (keeping the escape fraction of X-rays from SF galaxies,
  , fixed at 1.0), as indicated in the plots. The blue and magenta curves correspond to the SF-only and SF plus PBH scenarios, respectively. In the leftmost panel, with
  , the SF-only case exhibits a much deeper absorption trough than the SF and PBH scenario. This difference arises because the additional X-ray emission from PBH-seeded galaxies produces excess heat, increasing the temperature of the IGM (Tk) as shown in the bottom panel of the figure. As
  decreases further (moving towards the right), the X-ray output from PBH-seeded galaxies and the corresponding Tk diminish, leading to a progressively smaller difference between the two signals. We also note the difference in the signals around 25 ≳ z ≳ 20. This can be attributed to the fact that SF and PBH together produce significantly more Ly-α photons compared to the SF-only model, as is also evident in panel (b) of 1.
Current usage metrics show cumulative count of Article Views (full-text article views including HTML views, PDF and ePub downloads, according to the available data) and Abstracts Views on Vision4Press platform.
Data correspond to usage on the plateform after 2015. The current usage metrics is available 48-96 hours after online publication and is updated daily on week days.
Initial download of the metrics may take a while.