


Open Access
Fig. 8.
Download original image
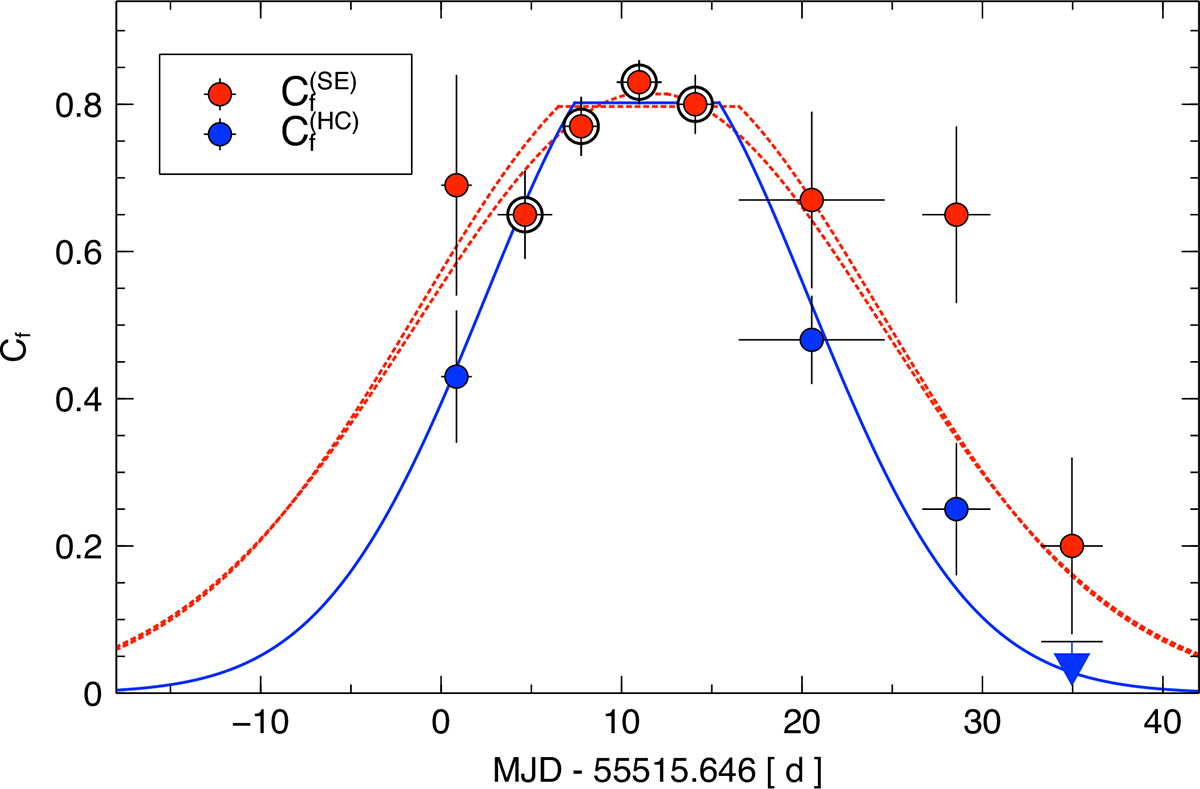
Evolution of the covering fraction towards the soft excess (red) and hot corona (blue). Black circles denote  . We also show flat-top Gaussian model-examples fitted to the Cf evolution of both components; see the main text for details.
Current usage metrics show cumulative count of Article Views (full-text article views including HTML views, PDF and ePub downloads, according to the available data) and Abstracts Views on Vision4Press platform.
Data correspond to usage on the plateform after 2015. The current usage metrics is available 48-96 hours after online publication and is updated daily on week days.
Initial download of the metrics may take a while.