


Fig. 5.
Download original image
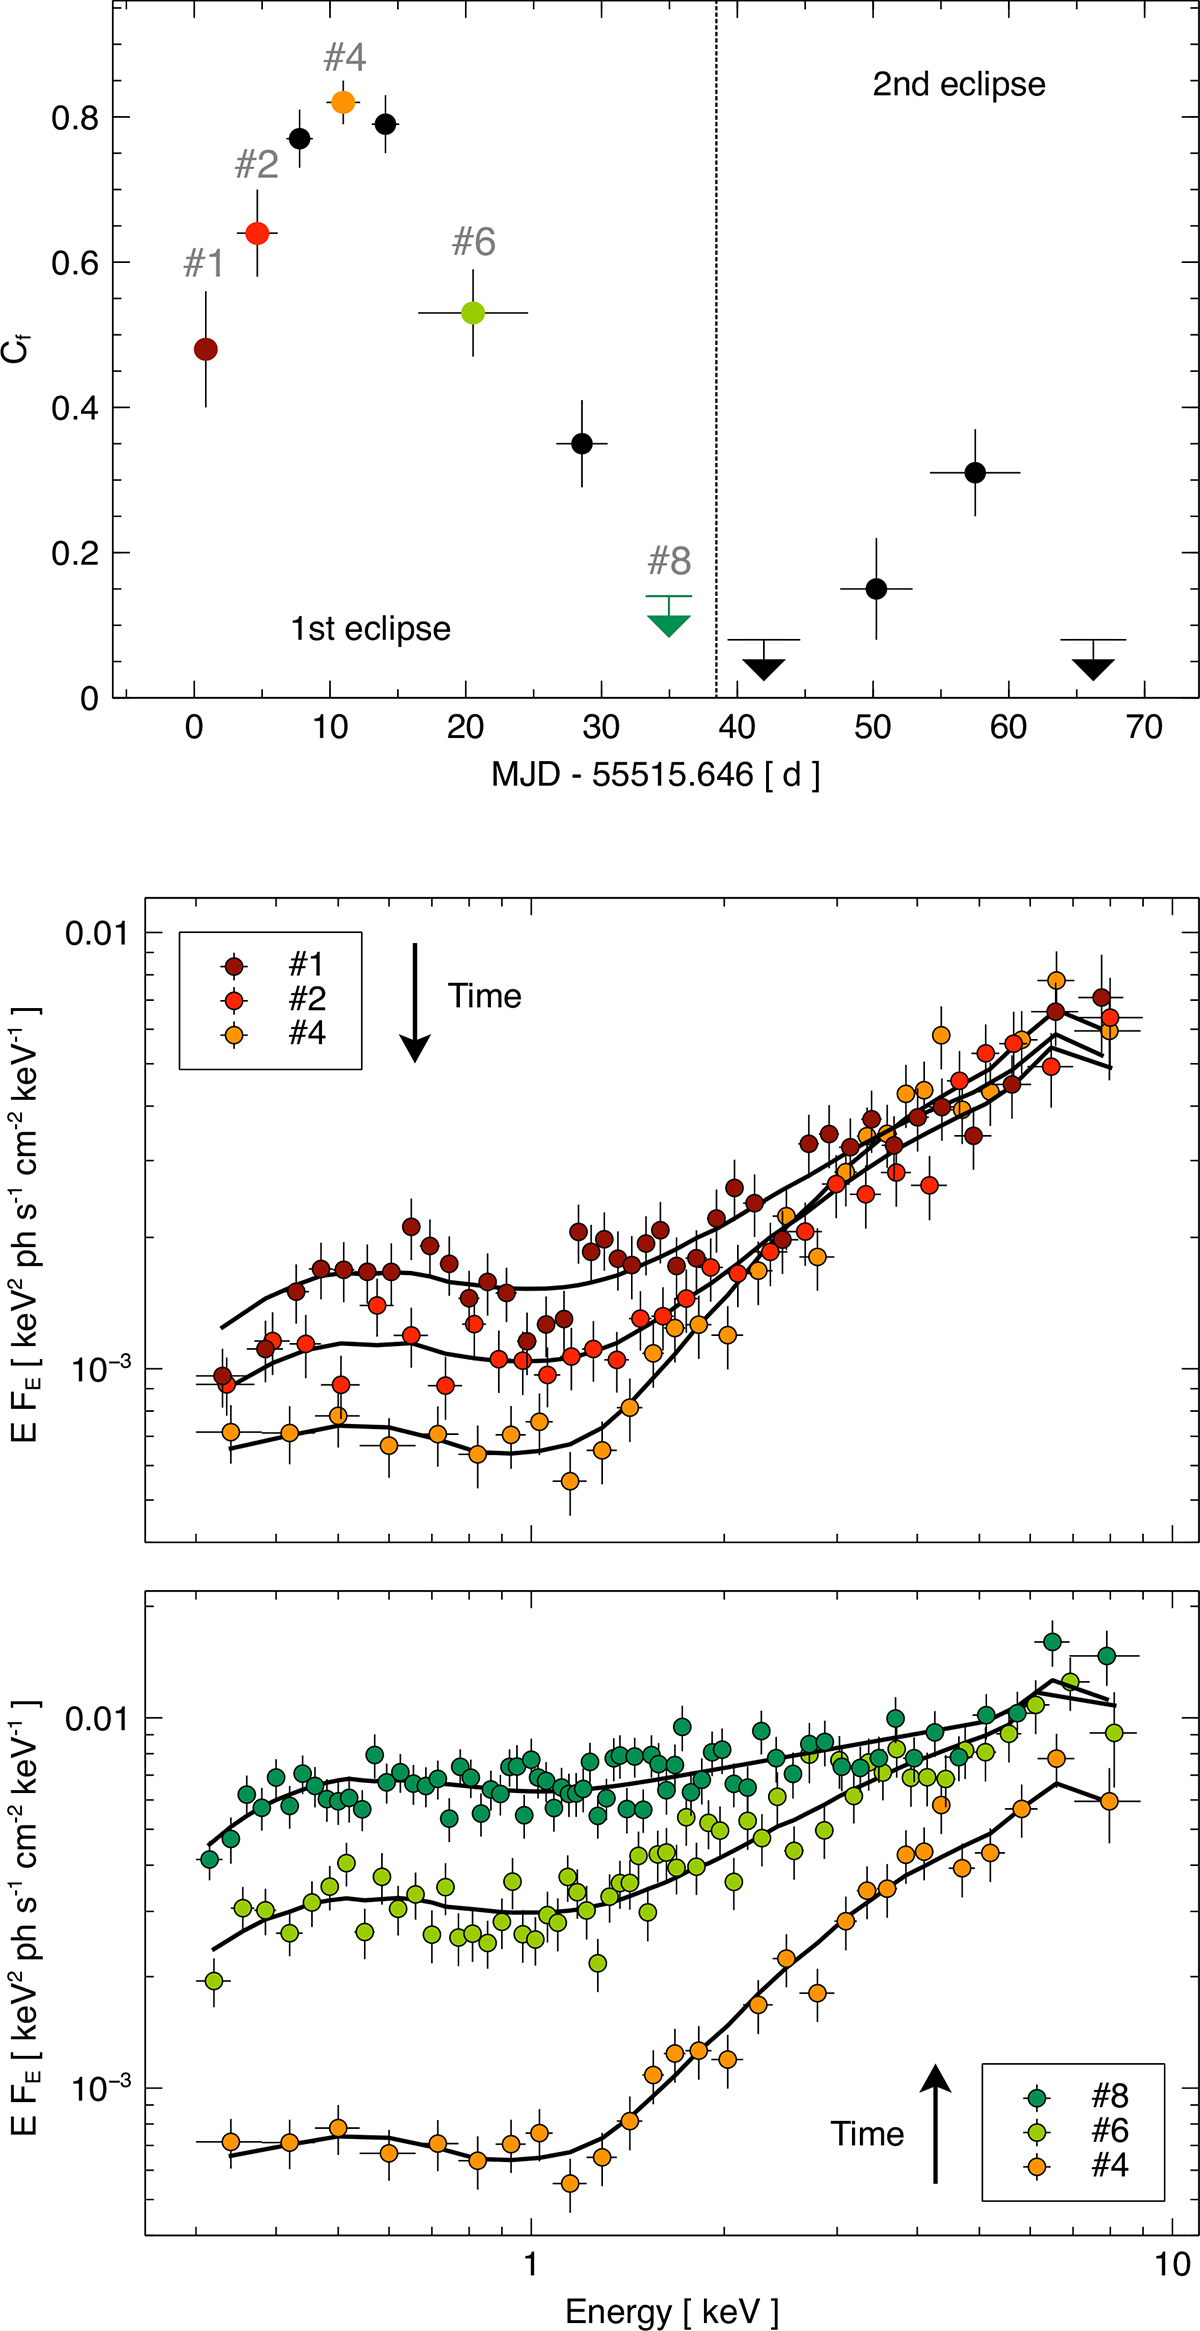
Top: Evolution of the covering fraction from the time-resolved spectroscopic analysis using model 1 (Table A.1). The data points corresponding to the spectra shown in the lower panels are numbered and colour-coded. Middle and bottom: Selection of X-ray spectra from the time-resolved spectral analysis. Spectrum 4, corresponding to the Cf peak, is repeated in both panels. All X-ray spectra were re-binned for visual clarity.
Current usage metrics show cumulative count of Article Views (full-text article views including HTML views, PDF and ePub downloads, according to the available data) and Abstracts Views on Vision4Press platform.
Data correspond to usage on the plateform after 2015. The current usage metrics is available 48-96 hours after online publication and is updated daily on week days.
Initial download of the metrics may take a while.