


Fig. 11.
Download original image
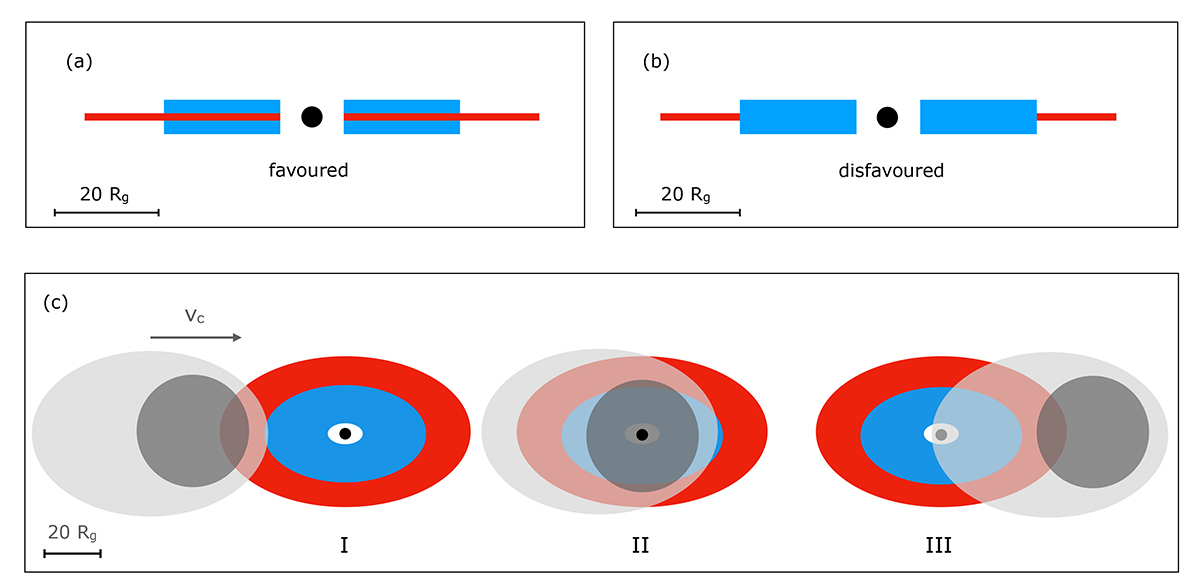
Panels a and b: Schematic representation of two possible geometries for the hot corona (blue) and soft-excess-emitting (red) regions. Our analysis favours a geometry in which the soft excess and hot corona co-exist in the inner region rather than one of pure radial stratification (which cannot, however, be firmly ruled out). Panel c: Schematic illustration of the occultation event. The drawing is approximately to scale, although the various structures sizes only represent one possible choice among the allowed ranges (see Table 4). The soft excess and hot corona emitting regions co-exist at the innermost radii and they appear as ellipses due to projection effects (i = 53°). The cloud core and atmosphere are represented as dark and light grey areas, respectively. The cloud motion proceeds left to right, as indicated by its velocity vector, and three eclipse phases are identified (see the main text for details).
Current usage metrics show cumulative count of Article Views (full-text article views including HTML views, PDF and ePub downloads, according to the available data) and Abstracts Views on Vision4Press platform.
Data correspond to usage on the plateform after 2015. The current usage metrics is available 48-96 hours after online publication and is updated daily on week days.
Initial download of the metrics may take a while.