


Fig. 9.
Download original image
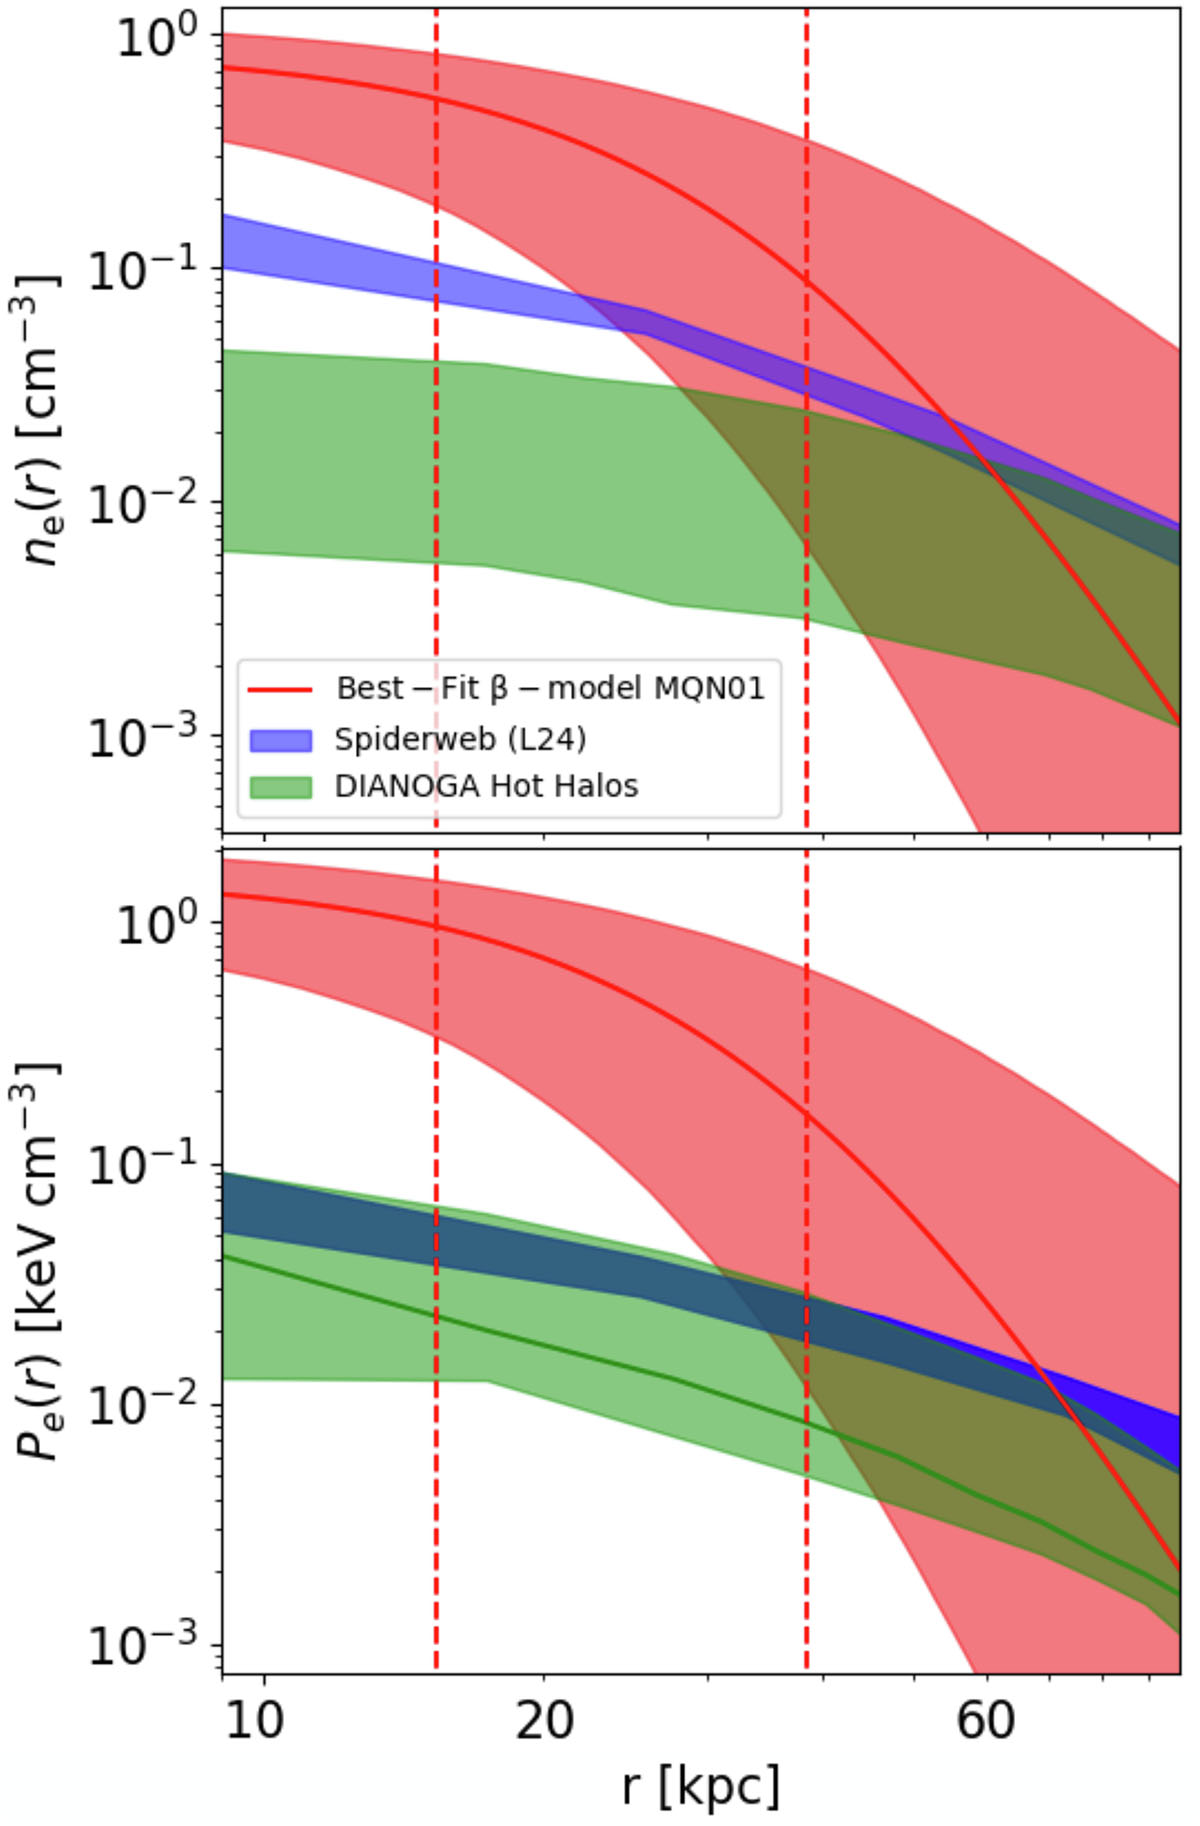
Electron density (ne(r)) and pressure (Pe(r)) profiles of the hot halos in MQN01 (red), Spiderweb (blue), and DIANOGA simulations (green). The red curve shows the best-fit model for MQN01, with the shaded region indicating the 68% confidence interval. The profiles of the Spiderweb halo is from L24, while the green band represents the range of profiles extracted from DIANOGA cosmological simulations of massive halos (∼2–6 × 10¹³ M⊙) at similar redshift as MQN01 (i.e. z = 3). The dashed vertical red lines indicate the radial range between 2″ and 5″, where we observe a significant detection.
Current usage metrics show cumulative count of Article Views (full-text article views including HTML views, PDF and ePub downloads, according to the available data) and Abstracts Views on Vision4Press platform.
Data correspond to usage on the plateform after 2015. The current usage metrics is available 48-96 hours after online publication and is updated daily on week days.
Initial download of the metrics may take a while.